Storm Tracker Analysis Tool and Archive
An interactive tool for tracking convective clusters from satellite and radar data*
Robert Rabin1,2 and Tom Whittaker2
1NOAA/National Severe Storms Laboratory
(NSSL)
2UW-Madison/CIMSS
This web site provides access to the following experimental products:
1.
Near real-time and archived satellite and radar data for the central
U.S.
National composite reflectivity from WSR-88D network (from UNIDATA)
Size (area)
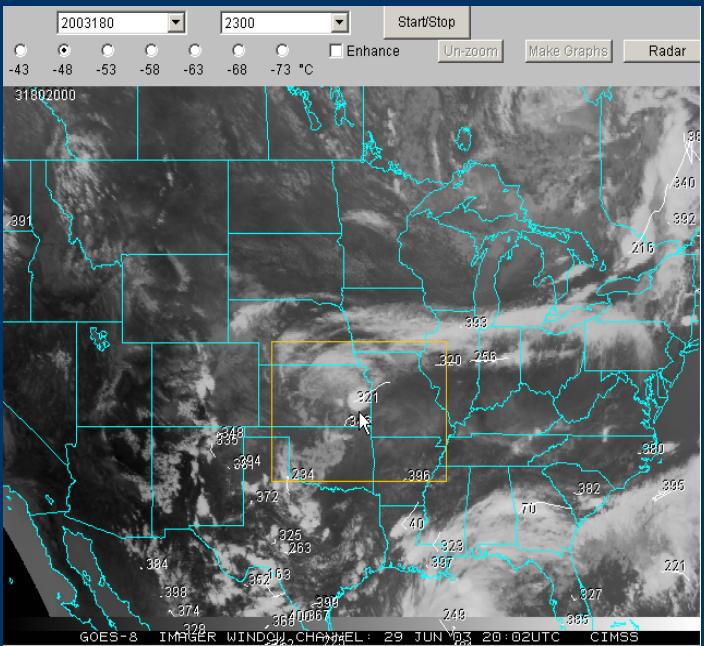
Cloud-top temperature (CTT)
Reflectivity (dBZ)
2. Interactive tools for identifying and tracking convective clusters
- Archive contents:
- Animations:
National composite reflectivity from WSR-88D network (from UNIDATA)
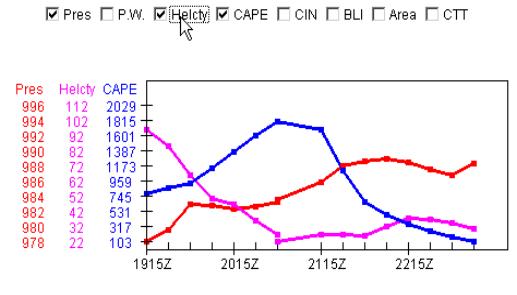
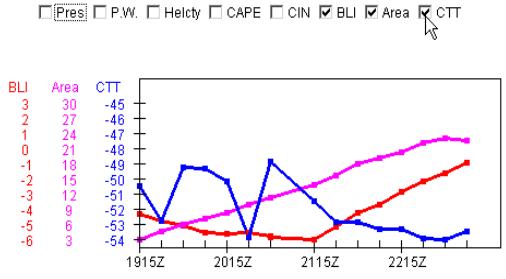
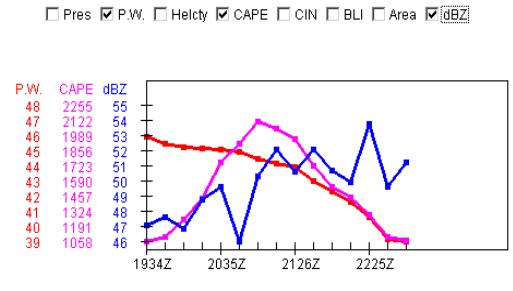
- Time series of tracked clusters:
Size (area)
Cloud-top temperature (CTT)
Reflectivity (dBZ)
2. Interactive tools for identifying and tracking convective clusters
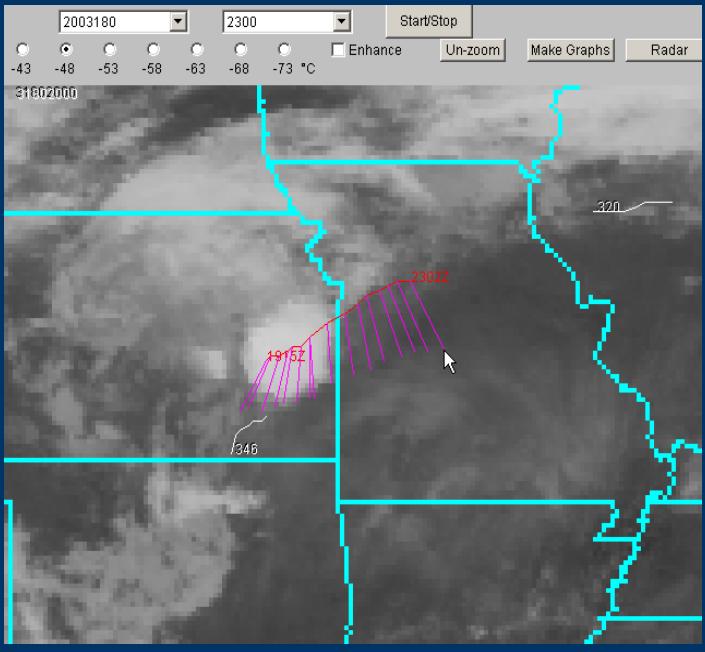
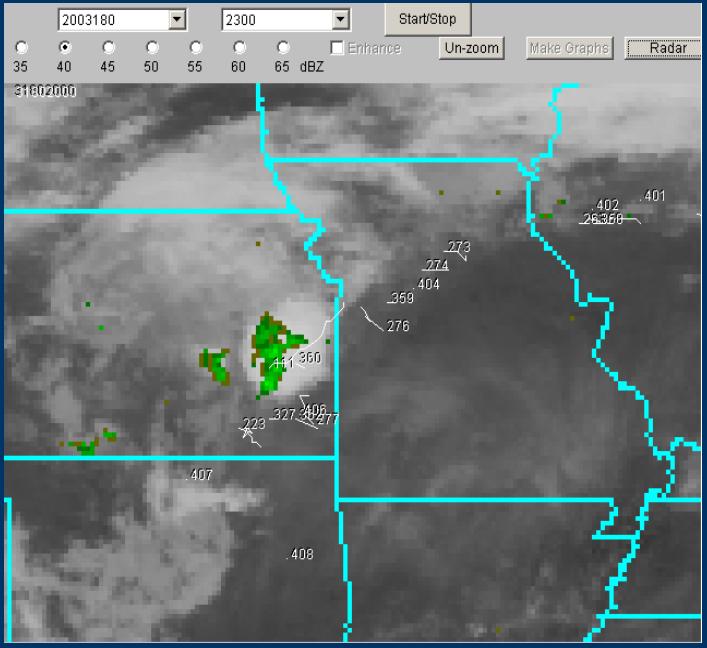
- Option to plot radar reflectivity overlayed on satellite images
- Selective magnification of images
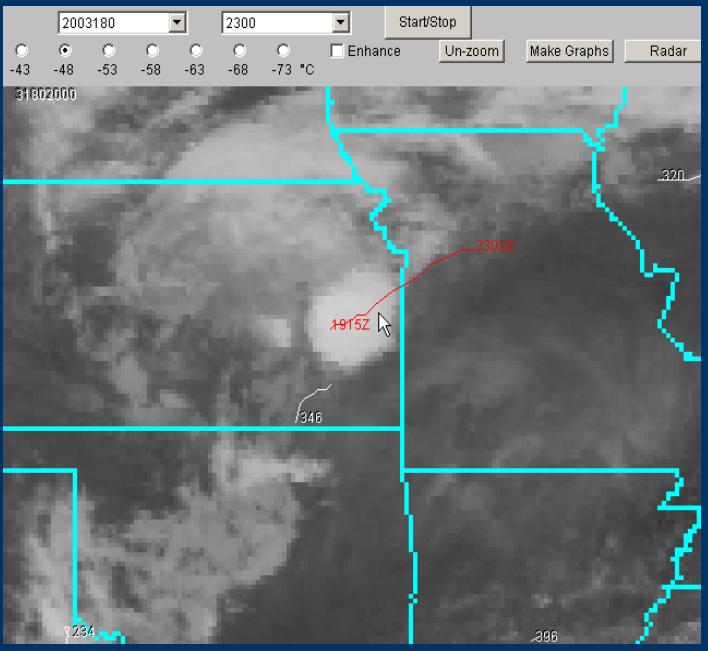
- Plot storm tracks based on cloud top temperature or radar reflectivity
- Vary the
scale of the cloud/reflectivity features tracked:
1)
Selectable Cloud-top Temperature threshold:
warmer: for tracking larger-scale convective systems
colder: for locating and tracking smaller-scale penetrating tops
2) Selectable Radar Reflectivity threshold:
smaller: for tracking larger-scale echo clusters
larger: for locating and tracking smaller-scale features
warmer: for tracking larger-scale convective systems
colder: for locating and tracking smaller-scale penetrating tops
2) Selectable Radar Reflectivity threshold:
smaller: for tracking larger-scale echo clusters
larger: for locating and tracking smaller-scale features
- Image inhancement to show clusters being tracked
- Animation of cluster movement and centroid tracks:
- Selection of individual storm track for display of time-series