Monthly News Summary – March 2012
- Suomi NPP Instrument Packages Already Hard at Work
- Increasing Lead Times for Hazardous Weather Warnings
- GOES-R Highlighted as Part of a NASA Outreach Effort
- CIMSS Software for Interrogating Stray Light Correction Data Introduced and Tested
- Polar Products Software Released as Part of Aqua and Terra Direct Broadcast Software Package
Suomi NPP Instrument Packages Already Hard at Work
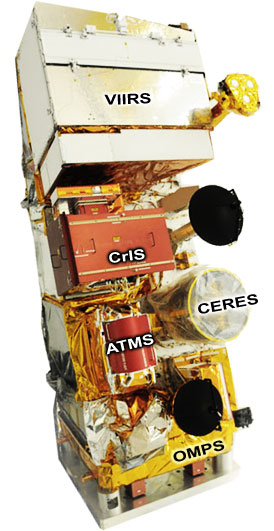
NASA’s newest Earth-observing satellite, the Suomi National Polar-orbiting Partnership (NPP), is a critical first step in building the next generation of satellite systems. Its many instruments are already providing key data critical for climate science:
VIIRS
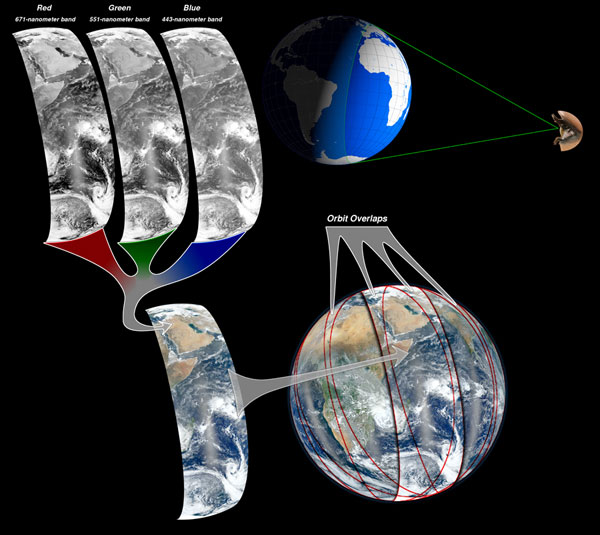
The Visible Infrared Imager Radiometer Suite (VIIRS) is the largest instrument onboard the Suomi NPP and collects radiometric imagery in visible and infrared wavelengths of the Earth’s land, atmosphere, and oceans.
Credit: NASA/NOAA.
CrIS
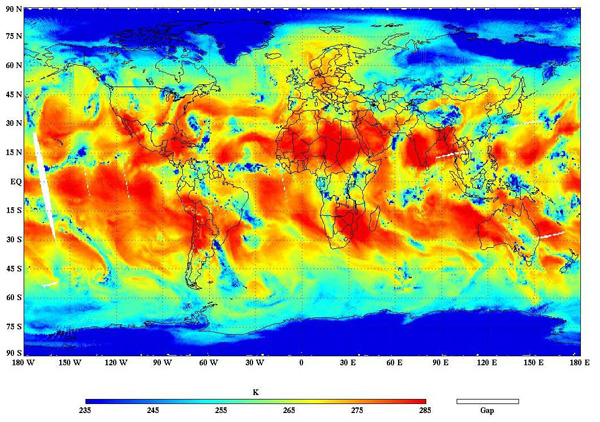
The Crosstrack Infrared Sounder (CrIS) signal processors were powered up on 7:48 EST on 20 January 2012. Calibrated radiance spectra were generated about 30 minutes after receiving the RDR data.
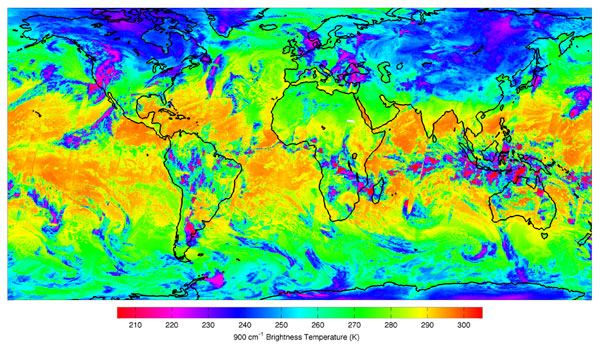
CrIS 900 1/cm brightness temperatures collected on 20 January 2012. Credit: NASA/NOAA.
Raw data was received at SSEC via the NPP Atmospheres Product Evaluation and Test Element (PEATE) and then processed with the CrIS Calibration Algorithm and Sensor Testbed (CCAST), developed jointly by CrIS Cal/Val colleagues at the University of Wisconsin-Madison and the University of Maryland Baltimore County to produce calibrated/geolocated radiance spectra. Sample figures show global images of 900 1/cm brightness temperature, and sample spectra.
SDR products were generated routinely by IDPS and available within another day. If the current schedule holds, the Cal/Val team will finish its early checkout phase, concluding with an upload of refined calibration coefficients, on 03 March 2012.
CERES
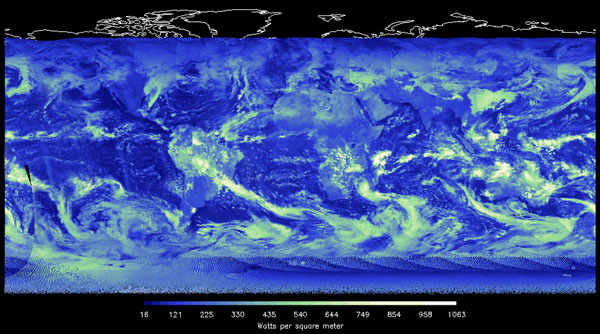
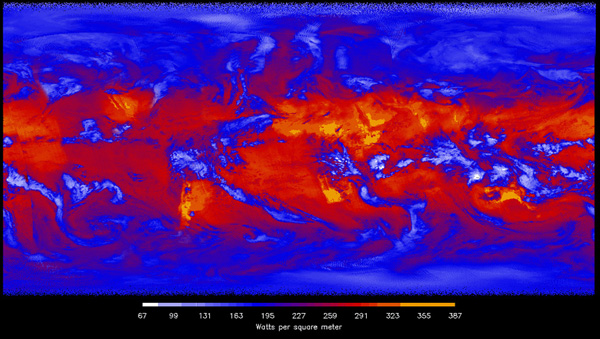
Continuing the pioneering work that commenced with Verner Suomi’s radiation budget experiment launched on Explorer 7 in October 1959, the Clouds and the Earth’s Radiant Energy System (CERES) instrument onboard the Suomi NPP satellite has begun scanning Earth, taking measurements of the energy leaving the Earth-atmosphere system.
The CERES results help scientists to determine the Earth’s energy balance, providing a long-term record of this crucial environmental parameter that will be consistent with those of its predecessors.
Thick cloud cover tends to reflect a large amount of incoming solar energy back to space (blue/green/white image), but at the same time, reduce the amount of outgoing heat lost to space (red/blue/orange image). Contrast the areas that do not have cloud cover (darker colored regions) to get a sense for how much impact the clouds have on incoming and outgoing energy. Credit: NASA/NOAA/CERES Team.
ATMS
The Advanced Technology Microwave Sounder (ATMS) is a cross-track scanner with 22 channels that provides sounding observations to measure atmospheric temperature and moisture useful for both weather forecasting and climate monitoring.
This global image shows the ATMS channel 18-microwave antenna temperature at 183.3 GHz on 08 November 2011. This channel measures atmospheric water vapor; note that Tropical Storm Sean is visible in the data, as the blue patch, in the Atlantic off the coast of the Southeastern United States. Credit: NASA/NOAA
OMPS
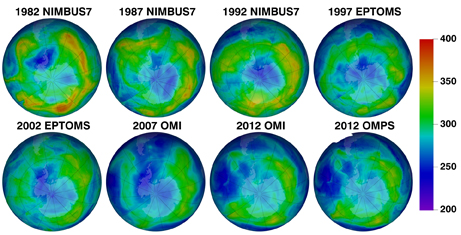
In addition, the Suomi NPP satellite instrument suite is now sending back detailed information about the health of the Earth’s ozone layer, the shield that protects the world’s population from harmful levels of the sun’s ultraviolet radiation.
The Ozone Mapper and Profiler Suite (OMPS) is one of five new instruments flying aboard NASA’s Suomi National Polar-orbiting Partnership satellite (NPP), which was launched on 28 October 2011. Suomi NPP is the result of a partnership between NASA, the National Oceanic and Atmospheric Administration and the Department of Defense.
These images show the thickness of the Earth’s ozone layer on 27 January from 1982 to 2012. This atmospheric layer protects Earth from dangerous levels of solar ultraviolet radiation. The thickness is measured in Dobson units, in this image, smaller amounts of overhead ozone are shown in blue, while larger amounts are shown in orange and yellow.
These ozone measurements begin with the Nimbus 7 satellite; continue with the Earth Probe Total Ozone Mapping Spectrometer (EP TOMS); the Ozone Monitoring Instrument (OMI) aboard the Aura satellite; and the most recent, the Ozone Mapper Profiler Suite (OMPS) aboard the satellite Suomi National Polar-orbiting Partnership (NPP). Credit: NASA/NOAA.
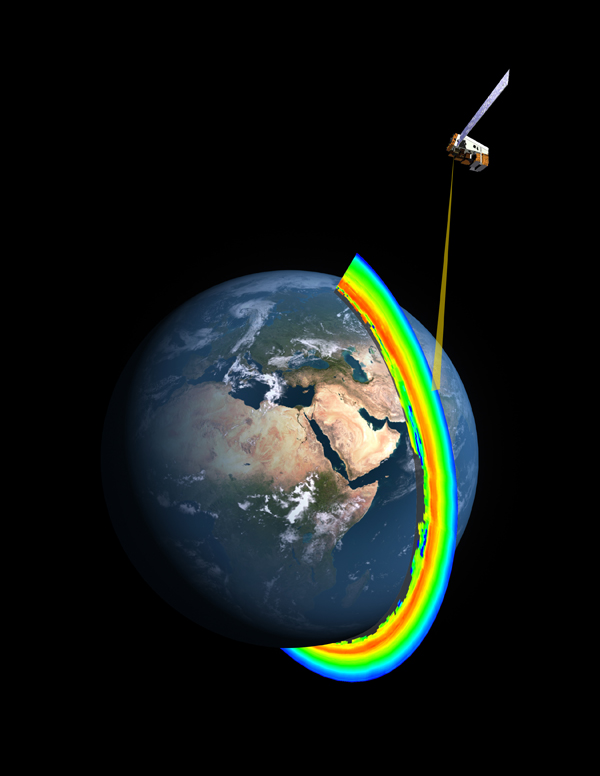
A cross-section of the Earth’s ozone layer as measured by the limb profiler, part of the Ozone Mapper Profiler Suite that’s aboard the Suomi NPP satellite. A new instrument, the limb profiler makes high vertical resolution measurements of of the ozone layer, a shield that protects the Earth’s surface from the sun’s dangerous ultraviolet radiation. Smaller amounts of overhead ozone is shown in blue, while larger amounts are shown in orange and yellow. Credit: NASA/NOAA.
Honoring Verner Suomi, Satellite Meteorology Pioneer
NASA and NOAA renamed their newest Earth-observing satellite after Verner Suomi, the longtime University of Wisconsin-Madison professor often called the father of satellite meteorology. The National Polar-orbiting Operational Environmental Satellite System Preparatory Project (NPP) satellite now functions as the Suomi NPP — the Suomi National Polar-orbiting Partnership.
Suomi, who died in 1995, spent nearly his entire career at UW-Madison. He may be best known for the spin-scan camera, which allowed satellites in stationary orbit of one point on Earth to maintain continuous focus and enable, among other capabilities, the instant-replay-style weather images that are used on television.
More information about the Suomi NPP can be found at NASA and NOAA, on the AMS blog, at the UW-Madison news site, and in previous news releases from SSEC and CIMSS.
Increasing Lead Times for Hazardous Weather Warnings
UW-Madison researchers Ralph Petersen, Jason Otkin, and Jun Li of CIMSS, along with Tim Schmitt and Brad Pierce of the Advanced Satellite Products Branch (ASPB) participated in the Regional Observing System Simulation Experiments (OSSE) workshop and the High-Impact-Weather/Warn-On-Forecast workshop held 07-09 February 2012 in Norman, OK.
Warn-on-Forecast is a National Oceanic and Atmospheric Administration (NOAA) research program tasked to increase tornado, severe thunderstorm, and flash flood warning lead times. A primary strategic goal for NOAA is increasing the lead-time and accuracy for hazardous weather and water warnings and forecasts, in order to reduce loss of life, injury, and damage to the economy.
Left: An ensemble of storm-scale NWP models predicts the path of a potentially tornadic supercell during the next hour. The ensemble is used to create probabilistic tornado guidance.
Right: Probabilistic tornado guidance: Forecast look on track, storm circulation (hook echo) is tracking along centerline of highest tornadic probabilities.
Image courtesy of NOAA National Severe Storms Laboratory
Oral presentations were given by the CIMSS/ASPB representatives on topics ranging from the need and generation of regional OSSEs, status of air quality OSSEs, Numerical Weather Prediction (NWP) opportunities for the Advanced Baseline Imager (ABI) and recent progress on assimilating satellite data for high-impact weather forecasting.
GOES-R Highlighted as Part of a NASA Outreach Effort
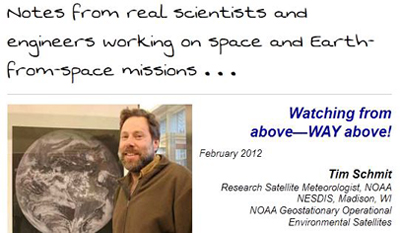
Tim Schmitt (NOAA/NESDIS) has written an article entitled “Watching From Above – WAY Above,” describing the GOES series of satellites and their importance in understanding the Earth’s weather and climate.
Intro section of the NASA Mission Chronicles web page.
The current GOES show Hurricane Katrina in five bands (frequencies) of light, while the new GOES-R advanced imager will detect 16 bands. Credit: UW-CIMSS, NOAA
The article is featured in NASA’s Mission Chronicles, part of “The Space Place,” an online publication jointly created by NASA, the Jet Propulsion Laboratory, the California Institute of Technology, and the International Technology and Engineering Education Association.
The Space Place is an education and public outreach project of NASA’s New Millennium Program, which continues to be its primary supporter. Its target audience is elementary-school-age kids. Its purpose is to reach the young audience with the message that science and technology and learning about space are fun and within their grasp.
CIMSS Software for Interrogating Stray Light Correction Data Introduced and Tested
On 09 February 2012, CIMSS released the latest version of UNIX and Man-computer Interactive Data Access System (McIDAS) software used to interrogate Stray Light Correction (SLC) information within Geostationary Operational Environmental Satellite (GOES) Imager and Sounder files.
This software will provide users at NOAA/NESDIS the ability to decide how to proceed with GOES Level-2 product generation when anomalous solar radiation contaminates certain wavelengths of terrestrial and atmospheric radiation during the twice-yearly (centered on the vernal and autumnal equinoxes) GOES eclipse seasons.
On 15-16 February 2012, a GOES Imager SLC test was performed by the Office of Satellite and Product Operations. This test sent corrected data via the GOES-13 GOES Variable (GVAR) datastream. Scientists at NOAA/NESDIS and CIMSS monitored the images during the test.
The correction performed was within the expected range and bits describing which lines were affected were filed into the line prefix. Once the correction is operationally implemented by NOAA/NESDIS, more imagery will be available via GVAR.
Polar Products Software Released as Part of Aqua and Terra Direct Broadcast Software Package
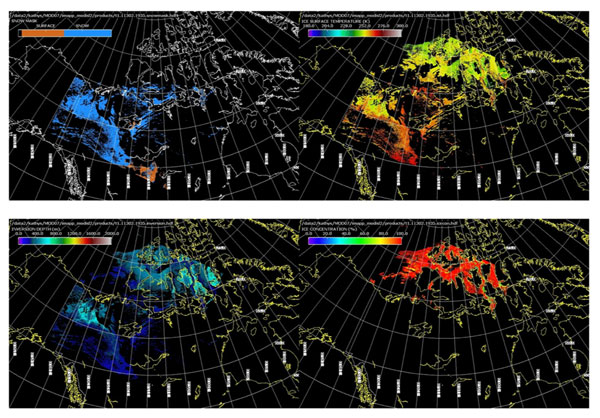
The University of Wisconsin-Madison cryosphere team, submitted software that will create 1km products in polar regions from direct downlinked MODerate Resolution Imaging Spectroradiometer (MODIS) input data. The software was incorporated into the International MODIS/AIRS Processing Package (IMAPP) MODIS Level2 package and released on 15 February 2012.
IMAPP has a registered user base of more than 1300 people from 67 different countries. The polar product software suite includes Snow Mask, Ice Surface Temperature and Surrounding Waters, Ice Cover and Ice Concentration, Inversion Strength, and Inversion Depth.
Example images of the IMAPP Snow Mask (Upper Left), Ice Surface Temperature (Upper Right), Inversion Depth (Lower Left) and Ice Concentration (Lower Right) Products for the 1935 UTC Terra MODIS test data set from 29 October 2011.

