The CIMSS Satellite Blog: “Ever awesome” at 20
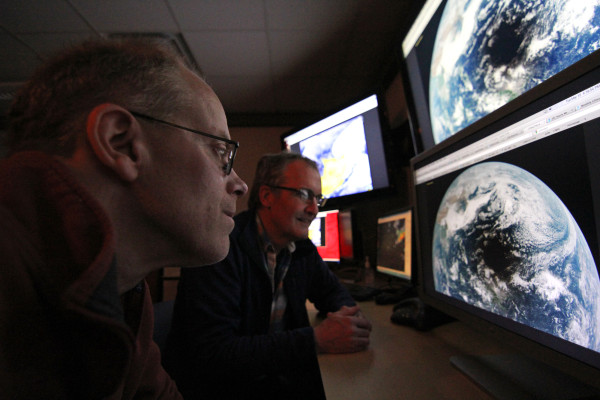
Scott Bachmeier (left) and Scott Lindstrom view the shadow of the total solar eclipse of 9 March 2016 that was captured by the JMA Himawari-8 geostationary satellite. Credit: Bill Bellon.
A perfect case study in and of itself, the CIMSS Satellite Blog circumnavigates the globe like the best Wisconsin Ideas.
For nearly 20 years, two Scotts – Bachmeier and Lindstrom – have taught the value of satellite imagery in the form of online case studies. They are atmospheric scientists at the University of Wisconsin-Madison Cooperative Institute for Meteorological Satellite Studies (CIMSS) who know the benefits of satellite imagery as a means to increase our understanding of Earth’s atmosphere.
Bachmeier and Lindstrom tell the compelling stories locked within those images.
Beginning in the early – and, by today’s standards, primitive – days of the World Wide Web, Bachmeier began developing case studies based on satellite data for the Virtual Institute for Satellite Integration Training (VISIT). Established by NOAA, the program was designed to use distance learning technologies to train National Weather Service (NWS) forecasters.
The VISIT collaboration was a natural fit for Bachmeier because it extended the educational reach of CIMSS. He says that VISIT was developed as a way to “improve the transfer of research to operations.” NWS forecasters anywhere in the world could learn about new ways to analyze remote-sensing data and imagery and incorporate it into their operational forecasts.
But disseminating large weather animations and images posed a challenge. So, in the mid-1990s, Bachmeier created the GOES Gallery. He says, “I began the GOES Gallery because I was gathering all of these cases and needed a library in which to store them.” Instead of placing all of the images in a directory on a computer, it was easier and more sensible to place them on a web page where others could view them.
“But in those days,” says Bachmeier, “it was a tedious operation, because I had to manually edit the HTML for every single page.”
Fast-forward to the early 2000s, when Bachmeier was introduced to a new era of blogging: He quickly learned how to use the software, immediately understanding its potential.
“This was awesome and a huge eye-opener because now I could enter the images and text without bothering with the HTML,” said Bachmeier. “I essentially started over.”
About that time, 10 years ago, Lindstrom joined Bachmeier as a blogger.
Between the two of them, they’ve dramatically increased the number of case studies available for training purposes, populating the CIMSS Satellite Blog with nearly 1,700 posts in just the last decade.
The case study approach is an effective method of teaching in many disciplines. In remote sensing, the method allows Bachmeier and Lindstrom to use tools developed at CIMSS or satellite data available at CIMSS to analyze atmospheric phenomena or events. They may look at one-minute imagery of a developing thunderstorm or monitor volcanic ash plumes or study the life cycle of a typhoon and its potential to affect weather in the United States.
“There are other blogs out there, but for satellite imagery, I don’t think anyone can approach the CIMSS Satellite Blog for quantity and quality,” says Lindstrom.
Bachmeier agrees. The blog format allows easy access to beautiful, and sometimes ominous, animations and imagery that the two scientists update several times each week. “That is how we differentiate ourselves,” says Bachmeier, “I’m really proud of our consistency and quality.”
Not surprisingly, the blog has become the go-to source for information and imagery on important weather events by other meteorologists. And, like many endeavors, new uses for the imagery and data have appeared over time and alongside the emergence of technologies such as social media.
How do they determine what is important?
As researchers at CIMSS, the two scientists tap into the SSEC Data Center, from which they have access to a wealth of data from satellite agencies around the world. They are constantly studying the satellite imagery, noting what looks interesting or what could prove to be instructive.
Bachmeier says, “I also pay attention to Twitter because a lot of what’s going on there is conversation about what’s going on in this or that part of the world.” Twitter has become invaluable because it is impossible for the two of them to keep an eye on all potential case studies everywhere on the planet.
“Or we pay attention to what is happening in the news,” adds Lindstrom. “Sometimes the really interesting images are linked to a high-impact news event. And if the images get out there quickly, people really pay attention to them.”
They are constantly asking themselves, “I wonder what that looked like via satellite?” And therein lies the story.
Lindstrom recalled the 2014 Air Algerie flight that crashed in Mali less than an hour after takeoff. He happened to look at the Suomi NPP track and discovered that the satellite had passed over the area precisely at the time of the crash. He wondered, “Could we see this with the day/night band?”
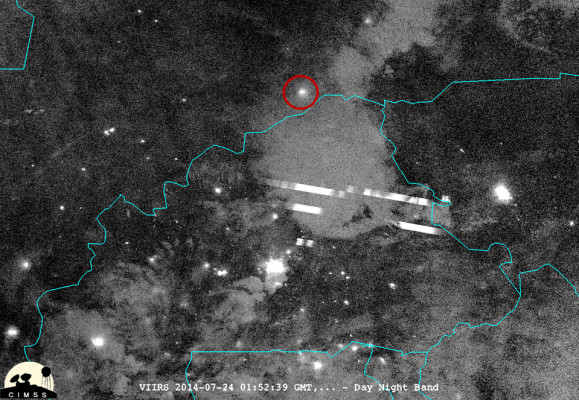
VIIRS Day/Night band image shows the light flare from the 2014 Air Algerie plane crash, circled in red. Suomi NPP was passing over the crash site between 1:55:00 and 1:55:30 UTC on 24 July 2014. Credit: William Straka, SSEC.
The answer was yes. The satellite provided high-resolution infrared and Day/Night Band imagery along the flight path: The plane had flown through a strong convective storm, causing the crash.
The scientists are meticulous about the details and analysis they provide in each blog post. Sometimes Bachmeier will “blast out” a few images via Twitter in advance of the post. This serves two purposes, says Bachmeier. “It is a way to alert offices of responsibility about an emerging event and it gives me time to process a blog entry in my brain first.”
In writing each post, they consider the kind of story they want to tell and what other images – upper air, radar, water vapor – would improve the story. Their goal is to be as comprehensive as possible with writing that is appropriate for other scientists as well as a public audience.
“We want to create understanding of how the imagery is important, so there is a lot of thought that goes into each post to make sure that what gets published is correct,” says Lindstrom.
Because of this attention to detail, the blog has established a dedicated and growing audience – with 40-50,000 hits daily, readership has expanded well beyond meteorologists to include students, educators, the public, government agencies, and many others.
Bachmeier fields questions from students on a regular basis. “They are often writing a paper and need an explanation of an image enhancement or tool that we’ve used to process the data.”
It’s been referred to as the “ever awesome” CIMSS Satellite Blog, with posts routinely picked up by media outlets around the world – from bloggers, to print media, to national evening newscasts – further spreading the word about the value of satellite data.
This animation, featured by Discover Magazine’s ImaGeo blog, shows the evolution of a cyclonic storm that became Hurricane Alex in January 2015. The CIMSS Satellite Blog was referred to as 'ever awesome.'
Other high-impact posts included the January 2016 eruption of the Popocatépetl Volcano in Mexico. The hot spot of the erupting summit as well as movement of the volcanic plume were visible on Suomi NPP VIIRS and Terra MODIS imagery. In 2012, Hurricane Sandy initiated many posts, all of them linking back to CIMSS research websites to explain how the storm formed, weakened, re-strengthened, and evolved.
“Our images draw the eye and, in the process, our readers are learning something,” says Lindstrom.
“I’m really glad that Scott is a co-author because he and I are able to look at a wider variety of cases,” says Bachmeier. “It would be fantastic if we could do a post every day because every day there is an interesting event somewhere on the globe – but how do you monitor the entire planet?”
Both Bachmeier and Lindstrom continue to be surprised at how grateful and appreciative people are when they talk about the blog.
“I do it because it is interesting,” says Lindstrom, “but that other people find it interesting, too, is very gratifying.”
By Jean Phillips