10.2. Working with ABI Level 2 Product Files
This example walks through the creation of GOES ABI Level 2 Product GeoTIFF image files and adding overlays.
Find the options available when creating GOES-16, -17 and -18 ABI Level 2 GeoTIFFs:
geo2grid.sh -r abi_l2_nc -w geotiff -h
List the products that can be created from your ABI dataset:
geo2grid.sh -r abi_l2_nc -w geotiff --list-products -f <path_to_files>
Geo2Grid now supports a number of different CSPP Geo ABI Science Products, including cloud top height (HT), cloud top temperature (TEMP), low cloud and fog (IFR_Fog_Prob,LIFR_Fog_Prob,MVFR_Fog_Prob,Fog_Depth), Land Surface Temperature (LST) and aerosol optical depth (AOD).
10.2.1. Creating ABI L2 GeoTIFF Cloud Product Images
Geo2Grid supports two cloud ABI cloud NetCDF products; cloud height which uses
a file product name of ACHA and cloud temperature files use which use
ACHT. For instance
CG_ABI-L2-ACHAC-M6_G17_s20223271831172_e20223271833556_c20223271834370.nc
CG_ABI-L2-ACHTC-M6_G17_s20223271831172_e20223271833556_c20223271834370.nc
You can provide Geo2Grid with both files for the same date/time and it will provide you the option to create both products with one execution.
To create GeoTIFF output files of both products found in this data set,
geo2grid.sh -r abi_l2_nc -w geotiff --num-workers 8 -f <path_to_files>
By default the products are color enhanced using the colormap:
$GEO2GRID_HOME/colormaps/abi_l2_modified_cloud_top.cmap.
Create just a Cloud Top Height GeoTIFF image:
geo2grid.sh -r abi_l2_nc -w geotiff -p HT -f <path_to_abi_files>
Create a Cloud Top Temperature image from the GOES-17 CONUS domain product created from 23 November 2022, 18:31 UTC ABI observations.
geo2grid.sh -r abi_l2_nc -w geotiff -p TEMP -f CG_ABI-L2-ACHTC-M6_G17_s20223271831172_e20223271833556_c20223271834370.nc
The resulting image is displayed below.
Fig. 10.3 CSPP Geo ABI AIT GOES-17 Cloud Top Temperature GeoTIFF image (GOES-17_ABI_TEMP_20221123_183117_GOES-West.tif)
Add a color table, coastlines, borders and latitude/longitude grid lines
to the image, and write the output to the file my_goes17_abi_ctt.png
using the add_coastlines.sh script. The script provides many options,
including the ability to add a colorbar title using the font of your
choice (provide the path to the font location on your local machine):
add_coastlines.sh GOES-17_ABI_TEMP_20221123_183117_GOES-West.tif --add-colorbar --colorbar-text-color="black" --colorbar-title="GOES-17 ABI Cloud Top Temperature (°K) 23 November 2022 18:30 UTC" --add-coastlines --coastlines-outline "black" --coastlines-level 1 --coastlines-resolution=i --add-borders --borders-level 2 --borders-outline gray --coastlines-width 2 --colorbar-tick-marks 10 --colorbar-font /usr/share/fonts/gnu-free/FreeSerifBold.ttf -o my_goes17_abi_ctt.png
Fig. 10.4 CSPP Geo ABI AIT GOES-17 Cloud Top Temperature GeoTIFF image with overlays (my_goes17_abi_ctt.png).
Users can aslo overlay Level 2 images onto other GeoTIFFs. In the example execution below, we overaly the Cloud Top Temperature GeoTIFF image on top of the GOES-17 true color image from the same time and name the output GeoTIFF “goes17_overlay_true_color_cloud_temperature.tif”.
overlay.sh GOES-17_ABI_RadC_true_color_20221123_183117_GOES-West.tif GOES-17_ABI_TEMP_20221123_183117_GOES-West.tif goes17_overlay_true_color_cloud_temperature.tif
The new combined GeoTIFF is displayed below.
Fig. 10.5 CSPP GOES-17 ABI cloud top temperatures overlaid on the coincident true color image from 23 November 2022, 18:31 UTC (goes17_overlay_true_color_cloud_temperature.tif).
10.2.2. Creating ABI L2 GeoTIFF AOD Product Images
One new supported Level 2 is the NOAA GOES-16 Aersol Optical Depth (AOD).
This product is a satellite retrieval of the extinction of light due to aerosols
in the atmosphere (for example, dust, smoke and pollution). The NetCDF product
files include AOD in the filenames. For example:
CG_ABI-L2-AODF-M6_G16_s20241202250202_e20241202259524_c20241202305210.nc
This is a full disk AOD retrieval file from day 120 (April 29), 2024, 22:50 UTC.
You can list the products available from the file using this command:
geo2grid.sh -r abi_l2_nc -w geotiff --list-products -f CG_ABI-L2-AODF-M6_G16_s20241202250202_*.nc
Which shows one product option, AOD available. This is the array AOD within the
NetCDF product file which is the ABI L2+ Aerosol Optical Depth at 550 nm.
To create a full disk GeoTIFF image output file from this input data set, you can execute the following command:
geo2grid.sh -r abi_l2_nc -w geotiff -p AOD -f CG_ABI-L2-AODF-M6_G16_s20241202250202_*.nc
By default the products are color enhanced using a rainbow colormap, with values ranging from 0.0 to 1.0. Values above 1.0 are enhanced to dark red.
For this example, we want to focus in on higher aerosol values for this day in Mexico
and the United States. So I will use the --ll-bbox option to create a cut out
region bounded by 10 to 40 North Latitude and -110 to -80 West Longitude.
To create an image covering this domain, I can use this command:
geo2grid.sh -r abi_l2_nc -w geotiff --ll-bbox -110 10 -80 40 --num-workers 8 -p AOD -f CG_ABI-L2-AODF-M6_G16_s20241202250202_*.nc
The resulting image is displayed below:
Fig. 10.6 CSPP Geo ABI AIT GOES-16 Aersol Optical Depth GeoTIFF image (GOES-16_ABI_AOD_20240429_225020_GOES-East.tif).
Now add an annotated color table, coastlines, borders and latitude/longitude grid lines to the image:
add_coastlines.sh GOES-16_ABI_AOD_20240429_225020_GOES-East.tif --add-colorbar --colorbar-text-color="black" --colorbar-title="GOES-16 ABI Aersol Optical Depth 20:52 UTC 29 April 2024" --add-coastlines --coastlines-outline "black" --coastlines-level 1 --coastlines-resolution=i --add-borders --borders-level 2 --borders-outline gray --borders-width 1 --coastlines-width 2 --colorbar-tick-marks 0.1 --colorbar-minor-tick-marks 0.05
The result is a PNG image with overlays as shown below.
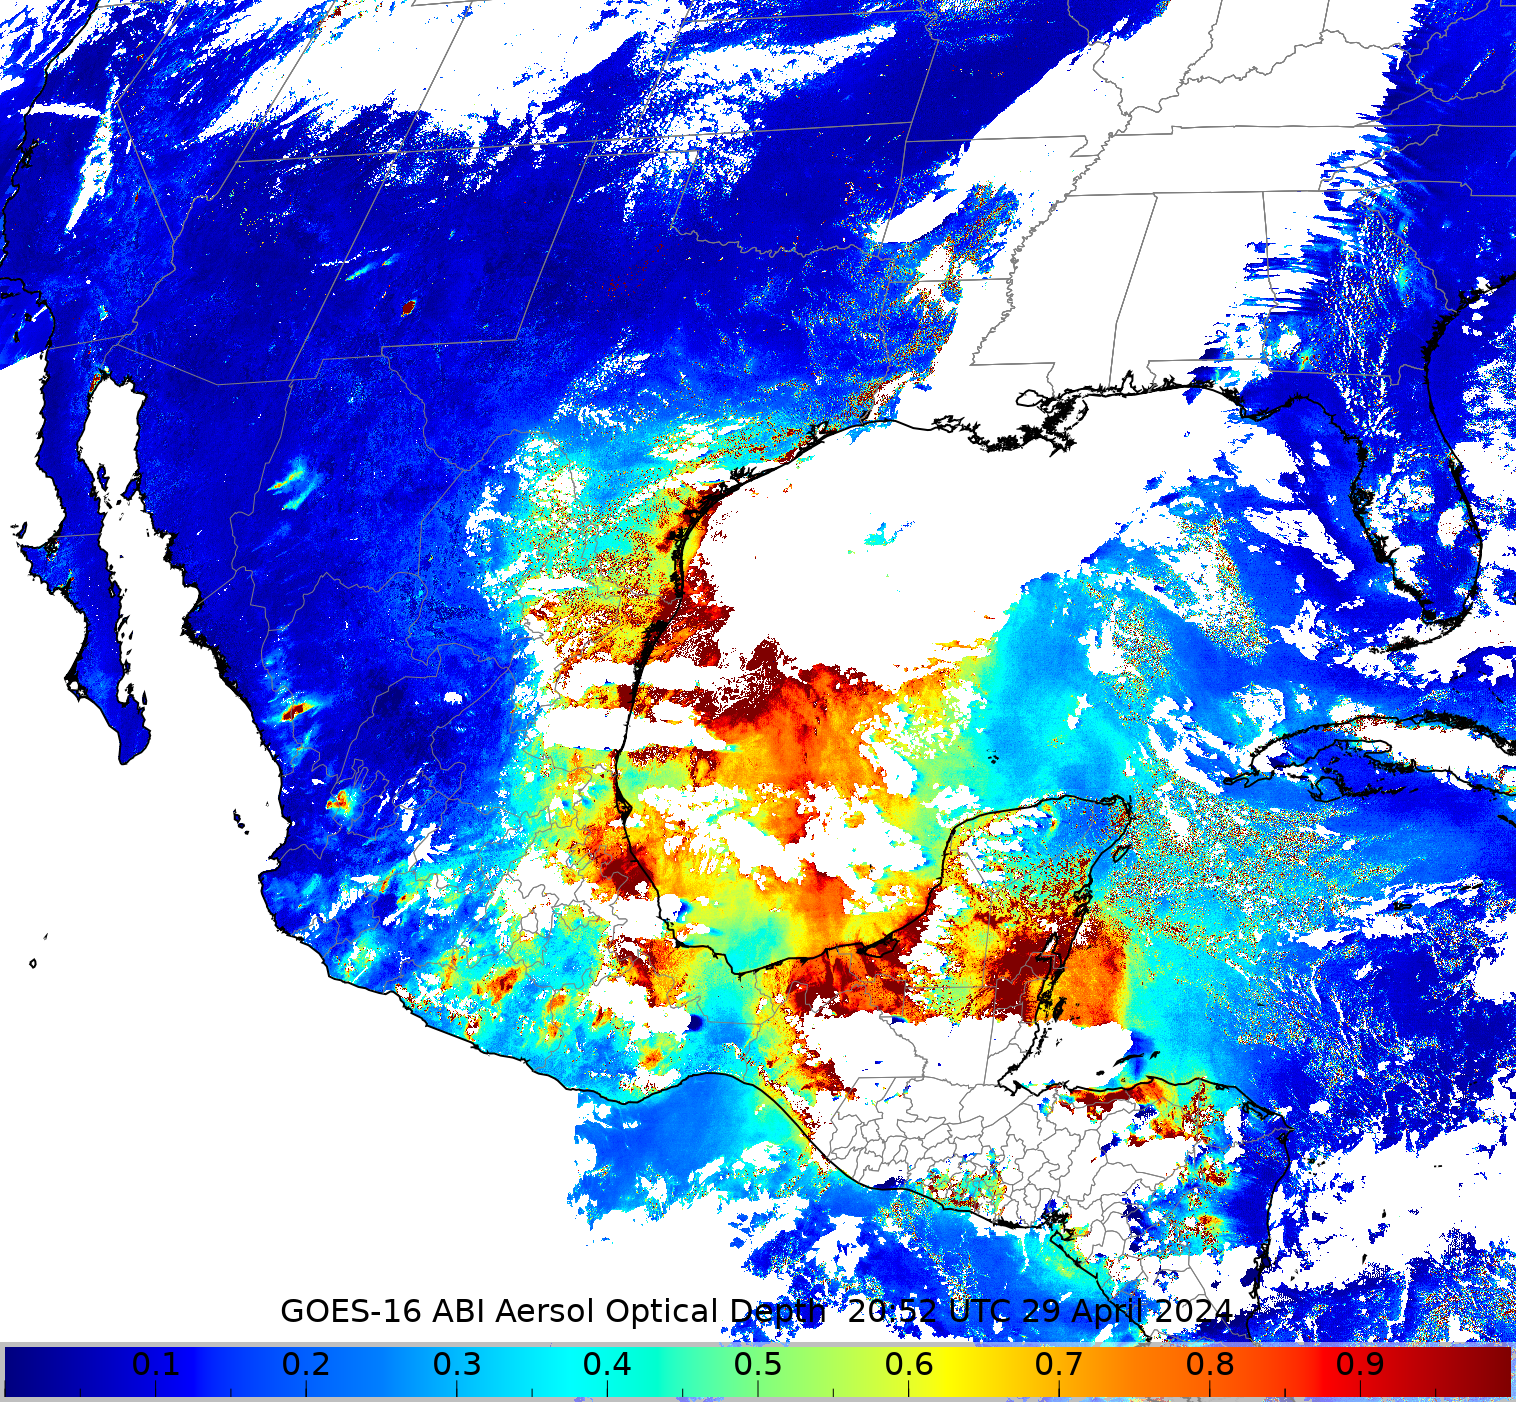
Fig. 10.7 CSPP Geo ABI AIT GOES-16 Aersol Optical Depth GeoTIFF image with added borders, coastlines and an annotated colorbar. The retrievals were created from April 29, 2024, 22:50 UTC observations.
To see the movement of the aersols during this day, an MP4 animation was made of the ABI Full Disk daytime AOD overlay files as similarily described in Using Geo2Grid to Create Animations. That animation is availble to view by following this link.