Air - Sea Interaction
|
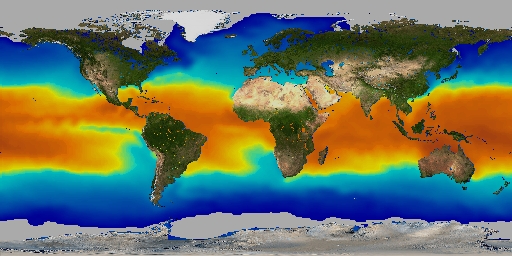
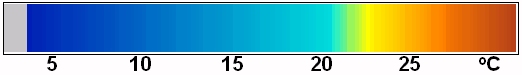
This animation was created by combining satellite imagery of atmospheric water vapor and sea surface temperature data. The bright milky white regions of the water vapor imagery show forecasters where there are high concentrations of water and the potential for stormy weather. As you watch the last 7-days of imagery, follow weather systems and see how their characteristics change and interact with each other. Notice how the 'tails' of mid-latitude storms stretch into the tropics to draw in moisture from the warm ocean waters. During the summer, meteorologist monitor sea surface temperatures to help forecast hurricane intensity. Sea surface temperatures warmer than 25C, (yellow and orange regions) are generally needed for the formation of hurricanes.
Further Information
Water vapor concentration |
Sea surface temperature |
 |
 |
 |
 |
 |
 |
This imagery has been provided by the University of Wisconsin, Hampton University and a grant from NOAA.
 |
 |