Northern Hemisphere Analyses
The following images and animations
illustrate the evolution of isentropic structure over the Northern Hemisphere
during the five day period December 15-19, 1992. The images were made from
data written at six hourly intervals from a global simulation by the UW
isentropic - sigma coordinate model.
The first set of images and animations
portray various fields superimposed on the pressure topography (exaggerated)
of several isentropic surfaces. The distributions are being viewed from
the south along 30 degrees west longitude.
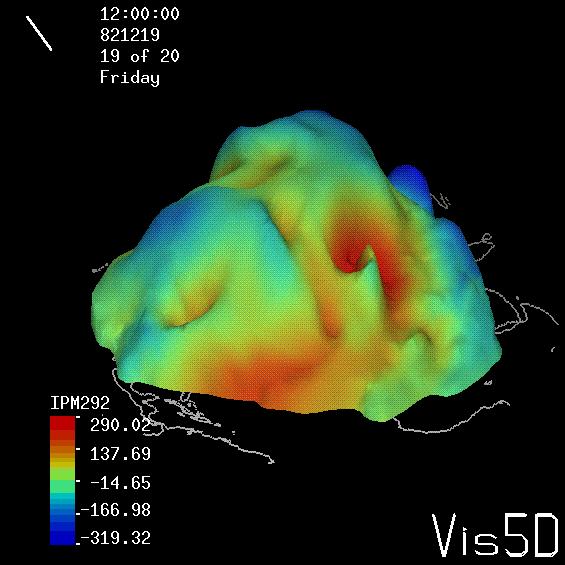
1. Deviation from the 292 K zonally average pressure superimposed
on the 292 K surface
Red (blue) represents regions of low (high) pressure relative to the zonal
mean.
12z December 19, 1992 (45 Kb jpg)
5 day FLI animation (900 Kb)
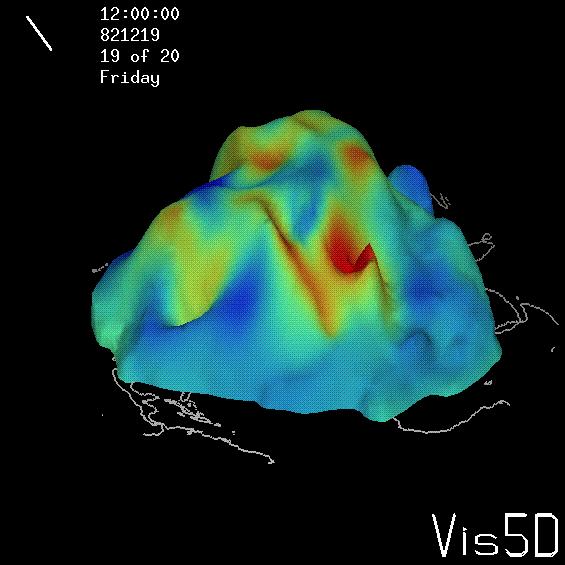
2. Mean Sea Level Pressure superimposed on the 292 K surface
Red (blue) represents regions of relatively low (high) mean sea level pressure.
12z December 19, 1992 (45 Kb jpg)
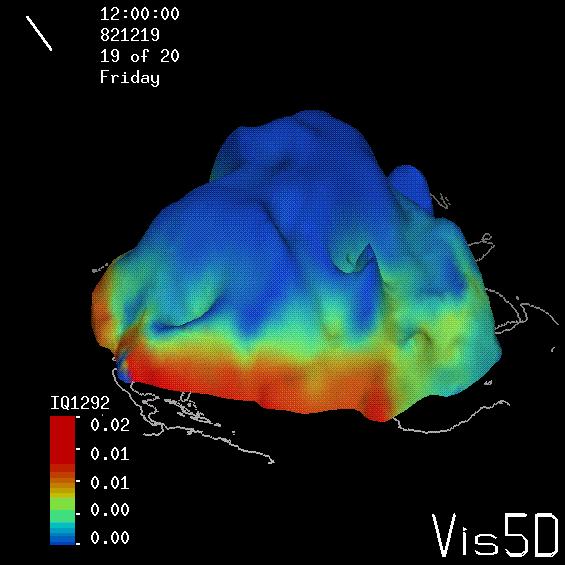
3.
292 K specific humidity superimposed on the 292 K surface
Red (blue) represents regions of relatively high (low) values of specific
humidity.
12z December 19, 1992 (45 Kb jpg)
5 day FLI animation
(1.7 Mb)
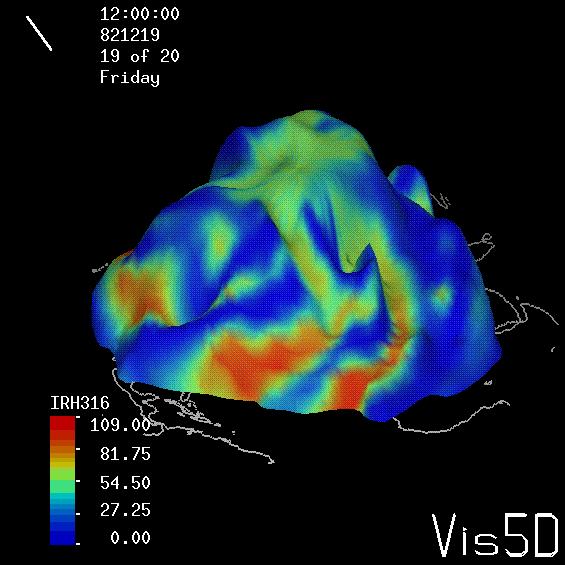
4.
292 K relative humidity superimposed on the 292 K surface
Red (blue) represents regions of relatively high (low) relative humidity.
12z December 19, 1992 (45 Kb jpg)
6 hour interval (FLI animation 1.7 Mb)
12 hour interval (FLI animation 900 Kb)
5. Relative humidity on the 332 K surface
12 hour interval (FLI
animation 1 Mb)
Southern Hemisphere Tracer Simulations
May 28 - June 2, 1994
1. 348 K Temperature Tracer
6 hour interval
2. 300 K Temperature Tracer Superimposed on 300k Surface
Topography, viewed along
90 East Longitude
6 hour interval
3. 300 K Temperature Tracer Superimposed on 300k
Surface Topography, viewed along
15 East Longitude.
6 hour interval
Return to the UW Isentropic Analysis and Modeling
Home Page