|
Storms in the 3.7 µm spectral band Weather satellites depict tops of convective storms in various spectral bands and each of these bands shows somewhat different features of the cloud top. Images in visible and near infrared bands (about 0.7 - 1.2 µm; e.g. theAVHRR channels 1 and 2, GOES-I/M channel 1, Meteosat VIS) provide us, among other, with information on storm top morphology and anvil thickness (transparency). Thermal band channels (about 10 - 12.5 µm; e.g. AVHRR channels 4 and 5, GOES-I/M channels 4 and 5, Meteosat IR) display structure of the thermal field which is mainly given by height of the cloud top. As already noted in the Introduction, the daytime appearance of convective storms in the 3.5 - 4.0 µm band (AVHRR channel 3, GOES-I/M channel 2) strongly depends on microphysical composition of the uppermost cloud top levels. Next, this band is discussed in detail. (The satellites, their instruments and channels which are mentioned above are not the only ones available - they are listed here because most of the images you'll find on these pages were recorded by one of these satellites. Other satellites or spectral bands either do not add any significant information to this research or have not been used so far - this will definitely change as new generations of weather satellites are launched into their orbits or as new processing methods are proposed.) If you are a beginner in the field of radiation science or if you want to refresh and/or deepen your knowledge here, please read first the online GOES 3.9 µm Channel Tutorial, developed by NOAA/NESDIS Cooperative Institute for Research in the Atmosphere (CIRA). (Don't worry for now about the fact that CIRA's tutorial deals with the GOES 3.9 µm band while the title of this section speaks about 3.7 µm - these are just central wavelengths of two different satellite channels, both located within the same spectral band. Though the two channels differ slightly as regards their spectral range, their properties are almost the same - at least when dealing with image interpretation.) After this return here to continue. If you want to know how to convert the original AVHRR 3.7 µm data into the "3.7 µm reflectivity" values, go here. Though this algorithm deals with the AVHRR data, the same method can be applied to any other satellite hosting similar spectral channels - e.g. GOES-I/M orMSG (Meteosat Second Generation). Please read carefully the limitations and simplifications of the method! And, of course, keep these limitations and simplifications in mind when working with the "3.7/3.9 µm reflectivity" images or data. Though the temperature difference between thermal IR channels and 3.7/3.9 µm channels is frequently used to characterize cloud top properties in the 3.7/3.9 µm spectral band, using the "3.7/3.9 µm reflectivity" is more appropriate from the physical point of view (in daytime hours, naturally). For the purposes of image interpretation, it doesn't make much difference if working with raw, enhanced 3.7/3.9 µm images or with images showing the computed 3.7/3.9 µm reflectivity. Figure 1 (bellow) plots Planck curves for solar reflection and earth/cloud emission within the 3.5 - 4.0 µm spectral band at different conditions. Red lines show the emitted radiation for various temperatures, while the blue ones represent solar reflected radiation for various reflectivity (alpha) and solar zenith angle (xi) values. The satellite-observed radiance at daytime is then a sum of these two components. Which of these is more important for the appearance of an observed surface depends on particular conditions. In the case of deep convective storms, the cloud top temperatures are typically between 190 - 230 K and the 3.7/3.9 µm reflectivity values range between 0.01 and 0.1 (the higher value for cases of "increased" reflectivity). As can be seen from the figure below, such combination means that the solar reflected component well outweighs the cloud's emitted radiance. However, as the solar zenith angle increases and sunset approaches, the two components begin to balance. Finally, at nighttime, only a weak emitted component remains. Unfortunately, the poor signal-to-noise ratio at the cold range of temperatures (below about 230 K) makes the 3.7/3.9 µm data almost useless for nocturnal observations of storm tops. 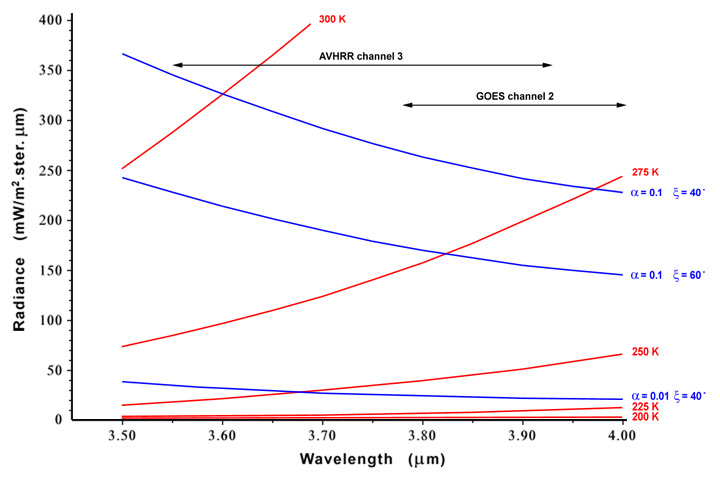 Typically, black and white images in the 3.5 - 4.0 µm spectral band are printed or displayed in such a manner that the regions of higher outgoing radiance are shown as dark whereas low radiancies are shown in light grey or white. This convention means that low and middle clouds (composed of warmer, highly reflective water drops) are typically shown dark grey to black, while tops of deep convective clouds and thick cirrus clouds are displayed almost white. This is generally true for standard enhancement and for "typical" convective storms only. However, there are storms whose tops are displayed somewhat darker than usual - which means that the total 3.7/3.9 µm radiance outgoing from them is for some reasons increased. Click here ( 4 June 1984, Germany ) to display an example of a storm with increased 3.7 µm radiance outgoing from the entire storm top. When you are there, please notice that there is also some text below the image window to read... There can be two reasons for such an increase of the 3.7 µm radiance: either higher temperature or increase of the 3.7 µm reflectivity. Examination of thermal IR images rules out the first quickly - the average cloud top temperature of storms with increased 3.7 µm radiance is more or less the same as that of other storms, which do not exhibit the 3.7 µm radiance increase. Moreover, the structure of the thermal IR field is completely different from that at 3.7 µm. Therefore, the explanation for such increase of the 3.7 µm outgoing radiance must be in the 3.7 µm reflectivity of the storm's cloud top. For this reason, it is legitimate to speak about "storms with increased 3.7 (or 3.9) µm cloud top reflectivity" - a term which will be used frequently from now on. (For simplicity - when speaking below about "reflectivity" without any spectral band/channel specification, it refers to the 3.7 or 3.9 µm data.) Before proceeding to a discussion of the nature of the increased 3.7 µm reflectivity, it is necessary to know what are its possible "forms" or "types". We have already seen above one example of a form when the increased (3.7 µm) reflectivity spreads out over the entire storm top. Here are several other similar cases:
However, this form of increased reflectivity is not too frequent. Significantly more common are cases when the increased reflectivity covers only part of the storm top. There are many variations of this form, differing by extent, shape or "sharpness" of the region of the increased reflectivity. One of these forms is a case, when the increased reflectivity is bound to the storm's core (a region above updrafts), with the rest of the storm top exhibiting only low reflectivity values: The other possibility is just opposite to the previous one - storm's core region exhibits low reflectivity, being surrounded by larger area of increased reflectivity: Sometimes it is possible to observe distinct cloud top "plume-like" features like in the two following cases: Since such features like the one above the Rumanian storm - which we started to call simply plumes - are very special phenomena and obviously are generated by some different mechanism than all the other forms of increased (3.7 µm) reflectivity, they are discussed in a separate section devoted only to these. The next case is rather unique - the channel 3 image shows a distinct rotation of the entire storm top, a feature which can not be resolved in any other band: So far, these have been rather simple cases - at least in terms of their "classification". However, the "Nature" typically doesn't recognize our "boxes" which we, humans, tend to use so often. In case of convective storms and their 3.7 µm reflectivity this means that the possible appearance of storm tops in this band is significantly more complex than described above. Most cases fail any "classification scheme", which means that the "boxes" from above are only artificial, descriptive tools resulting from "stand alone" or simplified mechanism which generates them. The appearance of cloud tops of majority of convective storms results from a full complex of processes which build them up and it may be somewhat rash to draw any conclusions about the nature of the increased reflectivity relying on satellite observations only (namely from polar orbiters). The next case documents the broad variety of types of the increased reflectivity: In many cases it is very difficult to decide about the actual height of the layer of the increased reflectivity - is it the uppermost layer of the dense anvil top and/or of overshooting tops, or is it a thin layer above these? The following case is an example of the latter: The absolute majority of cases of the increased reflectivity can be found in the afternoon or early evening NOAA passes. Only very few storms with increased reflectivity have been recorded so far in morning passes - here is the most prominent one: This concludes for now the "storm gallery" - more cases can be found in the next sections devoted to plumes and to the MOST project. Now it seems to be the right place to open a short discussion about the nature of the 3.7/3.9 µm cloud top reflectivity of convective storms. As the cases shown above suggest, it seems that there are several independent mechanisms which can generate highly reflective ice particles into the storm top. The final appearance of storm tops is then a result of combination of these, of their momentary efficiency and short term history. Based on NOAA/AVHRR "snapshots" only, we can just guess how did the particular 3.7 µm features evolve to form the storm top appearance which we observe at the time of NOAA satellite overpass. Before discussing the possible mechanisms, it is necessary to know what are the characteristics of (ice) particles which can increase the 3.7 µm reflectivity. According to numerical simulations (e.g. Hunt, 1973, Arking and Childs, 1985), typical deep convective cloud tops should exhibit a very low 3.7 µm cloud top reflectivity, while that of warmer clouds, composed of liquid water droplets, should be significantly higher. Thus, one of possible explanations of the reflectivity increase could be in the presence of small supercooled water drops generated by very strong updrafts. However, since the temperatures typical of cumulonimbus anvils are between -45 to -80°C (at European environment), the presence of supercooled water drops seems quite unlikely. Therefore the explanation for the increased reflectivity should be sought for among ice particles only. Arking and Childs (1985) have provided a detailed look at the theoretical sensitivity of the 3.7 µm reflectivity to particle size and phase; their results indicate high reflectivity for particles whose size approaches the AVHRR channel 3 nominal wavelength. Thus, the sought mechanism(s) responsible for the 3.7 µm reflectivity increase should be capable to produce small particles with the size of the order of several µm. One of these mechanisms could be the one already noted above - strong updrafts. However, not by means of ejecting small supercooled water drops into the cloud top, but by means of bringing them up as already frozen, very small ice particles. This mechanism could create the increased reflectivity which is either closely bound to the storm cores or which covers the entire storm top. Other possible sources of small particles could be sublimation of larger size particles in a dry environment or gravitational setting. Next possible source could be formation of "wave clouds" above the storm tops (e.g. pileus clouds). These can form in a very dry environment, which disables growth of the ice particles to a larger size. Consequently, particles from these can be carried away from their source to larger distances by upper level winds. All possible mechanisms mentioned in this paragraph would create "smudged", larger scale patterns of the increased reflectivity. Completely "stand-alone" is the mechanism which creates the "plumes". Since this type of the increased reflectivity is documented and discussed in detail in the next section, it will not be discussed here. So far, we have considered spherical ice particles only. Since this is far from the reality we also should take into account other types of ice particles. Unfortunately, the numerical computations of radiative properties of non-spherical particles are at their beginnings only, and we can therefore at this point only speculate about possible impact of the shape (form) of ice crystals and their orientation with respect to the Sun and the satellite on ice crystals' scattering properties. Nevertheless, we can expect that shape and orientation of ice crystals play also an important role in the 3.7 µm cloud top reflectivity. The last (but not least!) factor that is important
for the 3.7/3.9 µm cloud top reflectivity is the spatial
arrangement of illumination and scan. The influence of
scattering/scanning geometry involves solar zenith angle, scanning
angle and azimuth difference between the two. Though the impact of
these conditions can be traced even in the AVHRR imagery, it is much
easier to document it in the GOES-East/West imagery. |