Surface Wetness
Surface temperature over land is estimated from GOES-8/10
sounder retrievals in near real-time at CIMSS. These estimates approximate
the radiometric temperature and emissivity where sky conditions are clear.
Previous work by Diak et al. (1995) and others have shown the utility of
daytime heating rates of radiometric temperature in estimating daytime
sensible heat flux. The heating rate is obtained by differencing
the temperature near its peak in the afternoon from that near sunrise.
Using the difference in temperature rather than an average daytime temperature
reduces some of the possible errors associated with the temperature estimate
from satellite.
The heating rate has been computed on a daily basis
over the CONUS and then averaged over monthly periods. Ideally, the
temperature difference should be based on fixed solar times at all locations.
However, for simplicity, 21 -12 UTC has been used. The results appear
to be relatively insensitive to varying the beginning and ending times
by as much as 2-3 hours.
Maps of monthly average heating rates are given
in Table 1. Note that the general pattern in all of these images
is similar. Heating rates are greatest in the west where vegetation
is more sparse and the climate is dry.
Table 1
|
|
|
|
|
|
|
|
|
|
|
|
|
|
|
|
|
|
|
|
|
|
|
|
|
|
|
|
|
|
|
|
|
|
|
|
|
|
|
|
|
|
|
|
|
|
|
|
Deviations of the monthly mean heating rate from
the 3-year mean (1999-2001) are given in the first row of Table 2.
Smaller than average heating rates are indicated in green, larger than
average rates in cyan. Since the amount of surface heating is reduced
over wet surfaces or active vegetation with adequate root zone moisture,
it would be expected that the green areas be associated with wetter than
normal surface conditions, cyan with drier than average.
The maps of heating rates anomalies can be compared
with soil moisture anomalies in row 2 of Table 2. The soil
moisture anomalies are from the NOAA Climate Prediction Center and
are based on monthly precipitation and temperature data by NCDC climate
divisions and a one-layer hydrological model ( Huang
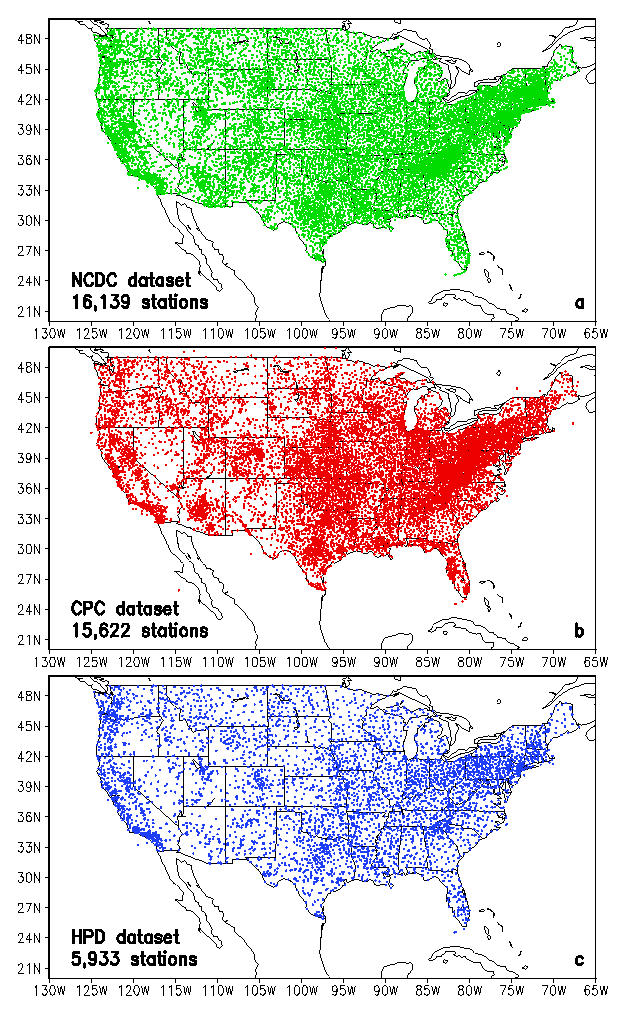
et al., 1996). Precipitation measurements are from the cooperative
surface network and other observations (see figure).
The soil moisture anomalies are based on departures from the 1971-2000
year mean.
The heating rates can also be compared to maps of
vegetation health in row 3 of Table 2. The maps of vegetation
health were obtained from Felix Kogan at NOAA/NESDIS. They are
based on the Vegetation and Temperature Condition Index (VT) which combines
information on the chlorophyll and moisture content of vegetation and thermal
conditions at the surface using the NDVI and infrared brightness temperature
from the AVHRR instrument (Kogan, 1997). The maps classify the vegetation
conditions from favorable to under stress relative to mean conditions from
1985-2001 for each NCDC climate division. Available at weekly intervals,
for simplicity the last week of each month was chosen for comparison with
the monthly mean heating rates.
Table 2
|
|
|
|
|
|
|
|
|
|
|
|
|
|
|
|
|
|
|
|
|
|
|
|
|
|
|
|
|
|
|
|
|
| Veg. Health |
|
|
|
|
|
|
|
|
|
To loop between the maps of heating rate anomalies,
soil moisture anomalies, and vegetation heath for each month, click on
the entries in Table 3. The loops use a Java
Applet written by Tom Whittaker at the Cooperative Institute
for Meteorological Satellite Studies ( CIMSS
) at the University of Wisconsin-Madison.
Table 3
|
|
|
|
|
|
|
|
|
|
|
|
|
|
|
|
|
|
|
|
|
Highlights of the comparisons
of monthly average heating rates, soil moisture anomalies, and vegetation
health:
June 1999: The general pattern of
a large wet area in the central US and dry in the east is reflected well
as below average heating in the satellite measurements. However, areas
of maxima wetness and minimum heating do not correspond well. For
example, the soil moisture is maximum in north central Oklahoma and North
Dakota, while the minima heating rate is found in southwest Nebraska and
southern Oklahoma. In the west, northern California is wetter than
normal, while the satellite indicates above normal moisture in northern
Nevada and slightly drier than normal in California.
In general, the distribution of vegetation health
compares well with the satellite heating rates. The favorable vegetation
conditions in Texas, Georgia, and South Carolina are consistent with the
below average heating rates while the soil moisture appears low in these
areas.
July 1999: The maxima soil moisture
anomaly in located in north central Oklahoma and western South Dakota,
while the driest area is in southern Ohio, Virginia, and Maryland.
These patterns generally correlate with the satellite measurements of heating
rates. However, the areas in Oregon, Idaho, Wyoming, and Montana
all appear to be drier from the satellite heating rates than indicated
from the soil moisture analysis.
The state of vegetation health generally reflects
the pattern of heating rates, except in some of the west where the vegetation
is fair to favorable and some heating rates are high. The favorable
vegetation in south Texas and eastward along the Gulf coast compares well
with below average heating rates there. Yet some areas of below normal
soil moisture occur in this same area.
June 2000: The minimum soil moisture
in the southeast is well depected from satellite. The minimum of
soil moisture in Nebraska and Iowa appear to be more widespread from satellite.
Most of the smaller areas of high soil moisture, such as in South Dakota,
northcentral Oklahoma, and southern Wisconsin have a reflection in the
satellite analysis of heating rates. The correlation is not particularly
high in the west, although some of the areas of below average soil moisture
in parts of Idaho, Utah, and Oregon are reflected in the satellite analysis.
In general, regions of fair to poor vegetation correspond
to the relatively high heating rates from satellite. The main exception
to this is in the southwest, where heating rates are small. Major
regions of favorable vegetation match locations of lower than average heating
rates.
July 2000: The extremely low soil
moisture in the southeast, minima areas in Nebraska, northwest Iowa, and
southern Texas are well captured in the satellite analysis of heating rates.
High soil moisture in North Dakota, Wisconsin, Oklahoma, and portions of
the Northeast show in the satellite data as well. The satellite analysis
of below normal heating rates suggests a more continuous area of above
normal soil moisture from North Dakota through the Midwest to the east
coast in Virginia and northward. In the west, the broad area of drier
than usual soil moisture in the Great Basin is reflected in the above average
heating rates from satellite, although the detailed pattern does not correlate
well.
The patterns of favorable (stressed) vegetation
correlate well with the analysis of below (above) average heating rates.
June 2001: The above average soil
moisture in portions of Kansas, southeast Nebraska, northern Missouri,
southern Iowa, North Dakota, South Dakota, and Minnesota are reflected
as below average heating rates. However, the below average soil moisture
in the lower Ohio valley and eastern states does not correspond with above
average heating rates. Many of the very dry regions in the west have
locally high heating rates from satellite. However, the overall correspondence
between the soil moisture and heating rates is not particularly strong.
In general, the areas of high heating rates in the
west correspond well to areas of fair to stressed vegetation. Also,
there ia a good correlation between lower than normal heating rates and
favorable vegetation in the lower Ohio valley where below average soil
moisture is analysed.
July 2001: The dry areas from west
Texas, Oklahoma, northern Arkansas, through the lower Ohio valley, the
northeastern states, northeast Wyoming and western South Dakota, and northcentral
Montana are reflected well as above average heating rates in the satellite
analyses. However, much of the west has below average heating rates,
while the soil moisture analysis indicates neutral or drier than usual
conditions.
Most areas of favorable (stressed) vegetation in
the central and eastern U.S. correlate with areas of below (above) average
heating rates. The widespread areas of stressed vegetation in Utah,
Arizona, southern California, and Nevada do not coincide with above normal
heating, as would be expected.
Discussion:
Many of the soil moisture anomalies are detected in the analysis of heating rates from satellite on a monthly time scale. However, a significant number of discrepancies exist, particularly in the western states. There are several possible causes which may explain the lack of correspondence:
1. The 3-year mean of heating rates from satellite may not be representative of the long-term mean, such as 30 years used in determining the soil moisture anomalies.
2. Areas with high frequency of clouds during a month may have inadequate number of observations to be representative of the monthly mean.
3. Spatial separation between rain gauges may be insufficient to capture the local distribution of precipitation, and hence soil moisture, especially in some of the western states where rain gauges measurements are more sparse.
4. In addition to soil moisture, the capacity of vegetation to generate evapotranspiration influences the amount of sensible heat flux and heating rates as sensed from satellite. Root zone depth, vegetation type, health, and growth stage are also factors. For example, previous studies have indicated that the Antecedent Precipitation Index (API) becomes uncorrelated with heating rates (and sensible heat flux) in areas where green vegetation cover is high (e.g., Diak et al., 1995, Rabin et al., 2000).
The importance of vegetation state, in addition to
soil moisture, is apparent from the comparisons of the vegetation health
with the heating anomalies. There are several cases where the heating
rate anomalies have the expected correlation with vegetation condition,
where the soil moisture anomalies do not.
Precipitable Water
Precipitable water is estimated from GOES-8/10 sounder
retrievals in near real-time at CIMSS. Images of total and 3-layer
precipitable water are available on the web.
The total precipitable water is disseminated to the National Weather Service
for applications in short-range forecasting. As for the retrieval
of surface temperature, estimates of precipitable water are limited to
clear sky regions. Monthly means of total precipitable water
have been computed on an hourly basis for each month. The results
for each year (1999-2001) and the 3-year mean are available in Table 4.
Table 4
|
|
|
|
|
|
|
|
|
|
|
|
|
|
|
|
|
|
|
|
|
|
|
|
|
|
|
|
Note from the animations in Table 4 that, there
appears to be a diurnal trend in precipitable water in some regions.
This is especially evident when following the coverage of precipitable
water greater than 30 mm (green/yellow) in the central U.S. Note
for example, that there is an increase of several millimeters in Oklahoma,
Arkansas, Missouri, Kansas from 08 to 21 UTC in July 2000, A diurnal
trend is not so strong in other months, however peak values are still observed
in the afternoon and minima during the night. This may be the result
of evapotranspiration during the day and condensation (dew and precipitation)
at night.
All months show a strong inverse relation of precipitable
water to elevation. Highest values are in the southeast with a marked increase
to the north through the central states from June to July. There
is also a large increase in preciptable water from June to July in the
region surrounding the Gulf of California. From the 3 years analyzed, there
can be substantial interannual variations in the same month.
Monthly averages of total precipitable water has
also been computed on a daily basis (24 hours). The 3-year average
precipitable water for June and July is given in the last 2 columns of
Table 5. The precipitable water from each individual month is presented
as a deviation (or anomaly) from the 3-year average in the remaining columns
of Table 5.
Table 5
|
|
|
|
|
|
|
|
|
|
|
|
|
|
|
|
|
|
|
|
|
|
|
|
|
|
|
|
June and July of 1999 were relatively moist over much of the country, except it became drier than usual in the northwest in July. June 2000 was moist in the southwest and northeast, dry elsewhere. It was relatively dry over most of the country in July 2000. June 2001 was dry in the southern half of the U.S., moist in the north. July 2001 was moist in portions of the Plains and northern Rockies, drier than usual from the Great Lakes through the mid Atlantic states.
The anomaly precipitable water fields can be compared to anomaly soil moisture and satellite-based heating rates (surface wetness) in Table 6. The soil moisture and surface wetness anomalies are the same as presented in Table 3.
Table 6
|
|
|
|
|
|
|
|
|
|
|
|
|
|
|
|
|
|
|
|
|
Highlights of the comparisons
of precipitable water, surface and soil moisture anomalies:
June 1999: There's a relatively good correspondence between higher than normal precipitable water, soil moisture, and surface wetness in the middle of the country and below normal values of all parameters along the east coast.
July 1999: The spatial correspondence between anomalously high precipitable water, soil moisture, and surface wetness remains good in the central U.S. while drier than average conditions are reflected in all 3 parameters over the northern Rockies. However, higher than average precipitable water is observed over the dry surface conditions in the east from southern Ohio to the east coast. Apparently, there was an influx of atmospheric moisture into this region without lifting mechanisms for precipitation. The surface remained dry from the previous month.
June 2000: The general patterns of precipitable water, rainfall, and surface wetness anomalies correlate relatively well. The small-scale soil moisture and surface wetness anomalies in northern Oklahoma and northern Louisiana, southern Arkansas appear to have correspondingly high precipitable water anomalies. Other small-scale soil moisture features, such as that in southern Wisconsin, do not have a reflection in the precipitable water anomaly field. In the west, areas with above average precipitable water seem to be collocated with higher than average surface wetness (i.e., northern Montana, southwest Texas, New Mexico, Arizona, and southern California), while soil moisture appears to be below normal in those areas.
July 2000: Negative precipitable
water anomalies dominate and correlation with wet surface features is not
particularly high. The unusually dry air over the southern Rockies
and along the Gulf coast is located near major features of below average
soil moisture and surface wetness.
June 2001: The larger scale patterns
suggest a rough correspondence of the anomaly fields, however there are
differences in the detailed surface moisture patterns. In general,
the precipitable water anomaly patterns compare much better with the surface
moisture than with the soil moisture. Some examples are the moist areas
in southern Montana, the Dakotas, Minnesota and Iowa and the dry areas
of Oklahoma, New Mexico, Nevada, southern Wyoming and northwest Montana.
Exceptions are in northern Missouri, parts of the south, and southern Arizona.
July 2001: There is a rough correspondence
between low precipitable water and dry surface areas near the Great lakes,
Texas panhandle and mid Atlantic states, and high precipitable water
and moist surfaces over portions of the northern Rockies, Dakotas, and
southern Arizona and northwestern Mexico.
Discussion:
Anomalies of surface wetness and soil moisture are often correlated with anomalous precipitable water patterns on monthly time scales. However, exceptions exist due to different residence times of surface and atmospheric moisture. In particular, antecedent surface moisture conditions can change more slowly than atmospheric moisture patterns. In addition, above average precipitable water may coexist with below normal surface wetness, especially in coastal areas where advection of moist air from the ocean can dominate local evapotranspiration.
References:
Diak, G.R., R.M. Rabin, K.P. Gallo, C.M. Neale, 1995: Regional-scale comparisons of NDVI, soil moisture indices from surface and microwave data and surface energy budgets evaluated from satellite and in-situ data. Remote Sensing Reviews, 12, 355-382.
Huang, J., H. van den Dool, K.P. Georgakakos, 1996: Analysis of model-calculated soil moisture over the United States (1931-93) and application to long-range temperature forecasts. Journal of Climate, 9, No. 6,
Kogan, F.N., 1997: Global drought watch from space. Bulletin of the American Meteorological Society, 78, 621-636.
Rabin, R.M., B. Burns, C. Collimore, G. R. Diak,
W. Raymond, 2000: Relating remotely-sensed vegetation and soil moisture
indices to surface energy fluxes in vicinity of an atmospheric dryline.
Remote Sensing Reviews, 18, 53-82.