These are scatterplots of GOES-derived precipitable water values vs.
adjacent points, and I have done the scatterplot for different maxima
in separation values between the adjacent points. I have considered
data for one 24-hour period in late October 1999; I'm not sure if
I can think of a reason why they would vary substantially day-to-day.
Scatterplot of Adjacent Points
Spacing less than 25 km
![[This is a scatterplot of points with a maximum spacing of 25km]](PWDIFF25both.GIF) |
|
Spacing less than 30 km
![[This is a scatterplot of points with a maximum spacing of 30km]](PWDIFF30both.GIF) |
|
Spacing less than 35 km
![[This is a scatterplot of points with a maximum spacing of 35km]](PWDIFF35both.GIF) |
|
Spacing less than 40 km
![[This is a scatterplot of points with a maximum spacing of 40km]](PWDIFF40both.GIF) |
|
What do these plots tell you? For close spacing there isn't a lot of difference
in precipitable water from one point to another. Not too surprisingly, as the spacing increases, so too does the spread.
I wondered as I looked at these plots: is the difference a function of
spacing? To visualize that, I plotted the percentage difference between
adjacent points vs. the distance. Those scatterplots are below and they
will show you that as the distance between the two points, the percentage
difference can also increase.
Scatterplot of Difference vs. Distance
Spacing less than 25 km
![[This is a scatterplot of points with a maximum spacing of 25km]](DIFF25both.GIF) |
|
Spacing less than 30 km
![[This is a scatterplot of points with a maximum spacing of 30km]](DIFF30both.GIF) |
|
Spacing less than 35 km
![[This is a scatterplot of points with a maximum spacing of 35km]](DIFF35both.GIF) |
|
Spacing less than 40 km
![[This is a scatterplot of points with a maximum spacing of 40km]](DIFF40both.GIF) |
|
I sent this url to some satellite folks who work on the floors below me
at the Space Science and Engineering Center, and here is part of the
e-mail that I received:
Scott,

I think the biggest differences are due to comparisons between retrievals over
land vs ocean. Unfortunately we don't (yet) store a land/sea flag in the
MDfile.

We have seen how our retrievals more favorably compared to raobs at smaller
match distances. In fact, at large distances (say 1 degree), the guess is
better than the retrieval (because it's so smooth). But, by say 0.5 km the
retrievals are better.
So I recomputed the scatterplot, restricting the comparisons to over land.
I also used only GOES-8 or GOES-10 data -- I won't be comparing data
from two different birds, as that could introduce variability as well.
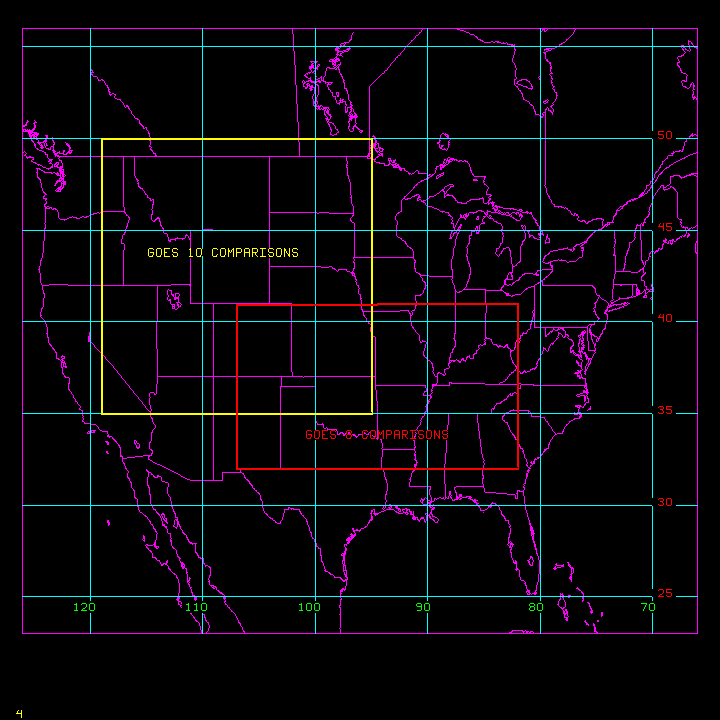
Here is a map of the locations included
in the comparisons. A table with all the scatterplots follows. Recall
that GOES 8 is over the equator at 75 W and GOES 10 is over the equator
at 135 W. I also include here in the table, for simplicity, the scatterplot
that contains all the data, i.e., those at the top of this webpage.
A couple of things I notice about these scatterplots. The most obvious
is that there is apparently more scatter in the GOES 10 instrument. This
could be a function of many things and I mention it only as something
that deserves further study. Note that the precipitable waters in both
GOES 8 and GOES 10 fields of view are roughly equivalent, even though
there are synoptic patterns where the deep south is significantly moister
than the Rocky Mountains. These data were collected when an intense
storm was off the east coast of the US and the eastern half of the
country was under strong northwesterly flow, so the Gulf of Mexico and
its moisture was shut off. (The date is 1 Nov 1999 -- the date the
Egypt Air plane went down off Nantucket). (If you notice something
interesting, please
e-mail me!
I also redid the plots showing the difference as a function of distance.
They are below.
The first thing I noticed about this is that there is more scatter
in the GOES-8 vs. GOES-10 data.
So I sent this url to the folks below me who know more about GOES
satellites than I do, and I got the following e-mail in return:
Scott,

When one looks at the instrument noise, GOES-10 is cleaner than GOES-8.

If GOES-10 has more scatter, I think it's due to the variability of the
terrain. Sfc pressure is very important for TPW determinations. To test this,
do your scatter plots sorting on the sfc pressure differences.
(Note above: TPW is total precipitable water, which we are trying to
measure).
Now this made me think to redo the difference scatterplot with surface
pressure as the y-axis; furthermore, I first did this in the region
where the GOES-8 and GOES-10 satellites overlap -- the high plains
of the USA. It is the intersection of the two areas shown in
this figure -- between 35 and 41 North
and between 100 and 107 West.
Difference as a function of surface pressure
Spacing less than 40 km [GOES 8]
![[Percentage difference as a function of surface pressure]](GOESEASTSFC.GIF) |
|
Spacing less than 40 km [GOES 10]
![[Percentage difference as a function of surface pressure]](GOESWESTSFC.GIF) |
|
Note above how as the pressure increases the spread difference between adjacent points increases. Can we conclude from this that the GPS/GOES
comparison will be better over flat land? I think so. One might argue
that the difference between adjacent points as the surface pressure varies
is an error -- one could also argue, however, that the difference is real.
As the surface pressure drops, the amount of atmosphere holding water
vapor is reduced, so the precipitable water will of course decrease. At
any rate, this suggests that if there is a big difference between a
GPS and a GOES data point, it could be related to pressure differences
in the data -- and this effect is much more likely over regions of
variable topography (mountains).
Finally, I made a using all data (GOES 8 and GOES 10) and looked at the
percentage difference in precipitable water at adjacent points as a function
of pressure difference between the adjacent points. There is an obvious
relationship between the two.
Difference as a function of surface pressure difference
Spacing less than 40 km [GOES 8 and GOES 10]
![[Percentage difference as a function of surface pressure difference]](PWPRES.gif) |
|
![[This is a scatterplot of points with a maximum spacing of 25km]](PWDIFF25east.GIF)
![[This is a scatterplot of points with a maximum spacing of 30km]](PWDIFF30east.GIF)
![[This is a scatterplot of points with a maximum spacing of 35km]](PWDIFF35east.GIF)
![[This is a scatterplot of points with a maximum spacing of 40km]](PWDIFF40east.GIF)
![[This is a scatterplot of points with a maximum spacing of 25km]](PWDIFF25west.GIF)
![[This is a scatterplot of points with a maximum spacing of 30km]](PWDIFF30west.GIF)
![[This is a scatterplot of points with a maximum spacing of 35km]](PWDIFF35west.GIF)
![[This is a scatterplot of points with a maximum spacing of 40km]](PWDIFF40west.GIF)
![[This is a scatterplot of points with a maximum spacing of 25km]](DIFF25east.GIF)
![[This is a scatterplot of points with a maximum spacing of 30km]](DIFF30east.GIF)
![[This is a scatterplot of points with a maximum spacing of 35km]](DIFF35east.GIF)
![[This is a scatterplot of points with a maximum spacing of 40km]](DIFF40east.GIF)
![[This is a scatterplot of points with a maximum spacing of 25km]](DIFF25west.GIF)
![[This is a scatterplot of points with a maximum spacing of 30km]](DIFF30west.GIF)
![[This is a scatterplot of points with a maximum spacing of 35km]](DIFF35west.GIF)
![[This is a scatterplot of points with a maximum spacing of 40km]](DIFF40west.GIF)