import graphor you must:
from graph import *If you choose the first form, the all your references to methods in must include "graph" -- that is: graph.histogram(data). If you use the second form then you omit the "graph" -- that is: histogram(data).
You may also have to import other things. For example, to use the Java Color, you will have to:
from java.awt import Colorfor example.
If you want, you can look at the Jython code for graph.py.
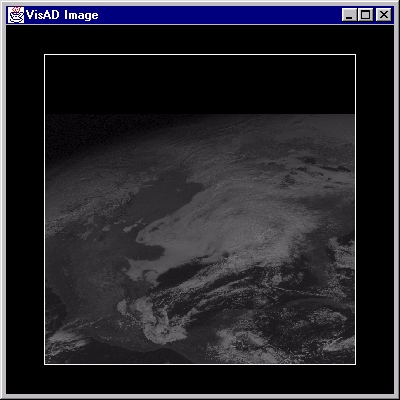
a=load("../data/mcidas/AREA0001")
graph.image(a)
produces this display:
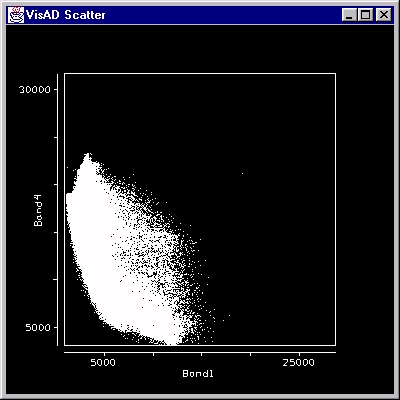
a=load("../data/mcidas/AREA0008")
b = extract(a,0)
c = extract(a,1)
graph.scatter(b,c)
produces this display:
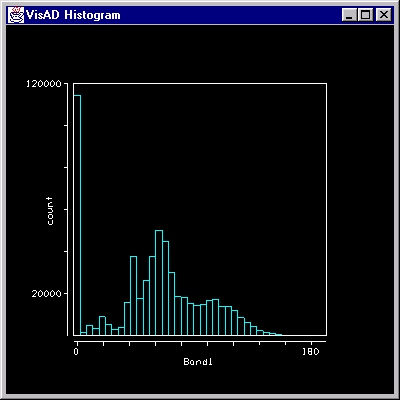
a=load("../data/mcidas/AREA0001")
graph.histogram(a, 40, color=Color.cyan)
produces this display:
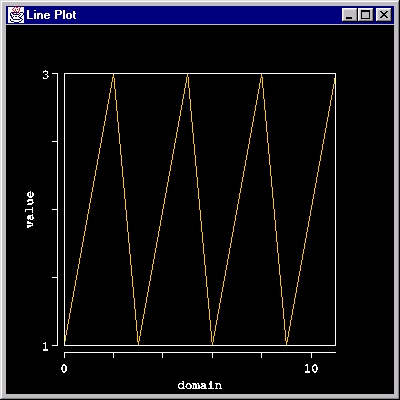
a=field( (1,2,3,1,2,3,1,2,3,1,2,3))
graph.lineplot(a, color=Color.orange)
produces this display:
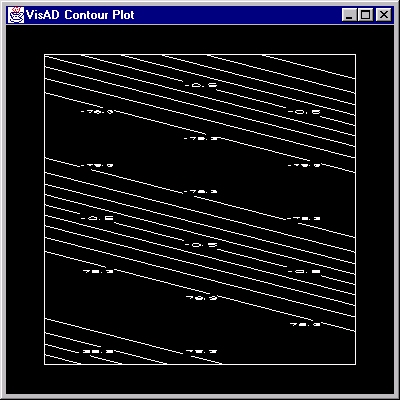
a=load("../data/text/example1.txt")
graph.contour(a)
produces this display:
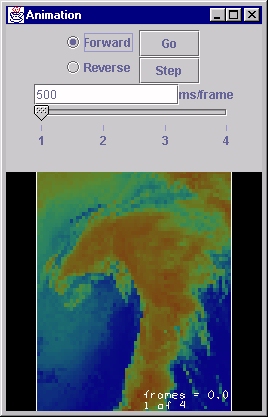
a=load("../examples/images.nc")
graph.animation(a)
produces this display:
You can also just use a sequence of JPEG or GIF images. For example:
a=load("image0.jpg")
b=load("image1.jpg")
c=load("image2.jpg")
graph.animation( (a,b,c) )