The Data Plotting Function
May, 2001
Introduction
The most basic display of a VisAD Data object is via the plot()
function. It is derived from the VisAD SpreadSheet's FancySSCell, and
gives you the fastest way to inspect data. By using the VisAD
Controls widget and the SpreadSheet's Mappings Window,
you have considerable flexibility in selecting portions of the Data
and how it will be depicted. The plot() function is capable of
line drawing, contours, etc.
There is also a clearplot() function available that allows you
to programmatically close a plotting window.
The many forms of plot()
There are many signatures for the plot() method, and there may
be more to come. Just before giving you the details of these, we
should first have a look at what the output display looks like.
What the plot() looks like
You'll notice when the display window pops up, it looks like:
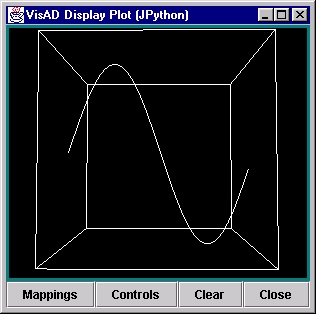
At the bottom are four buttons:
- Mappings - opens the mappings dialog
- Controls - opens the controls dialog
- Clear - clears the contents of this plot
- Close - clears the contents and closes this window
Both dialog contain information relevant to the Data object that
you're plotting. In our simple case, the Mappings dialog looks like:
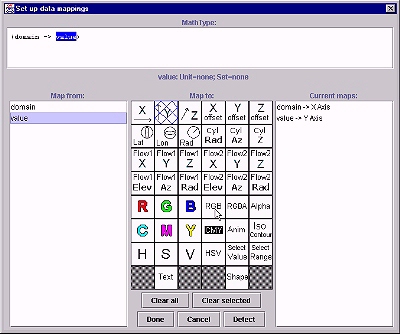
The "mappings" need a little defining. When a Data object is
displayed, VisAD needs to know what domain components to show along
what axes, and how to represent the range component(s). These are
referred to as the "scalar mappings". For example, if your Data
object is an image which has a domain of (Longitude, Latitude) and a
range named "brightness", you might want Longitude to be placed along
the X-axis of the plot, Latitude along the Y-axis, and brigtness to be
shown as a color (RGB).
The Controls widget appears as:
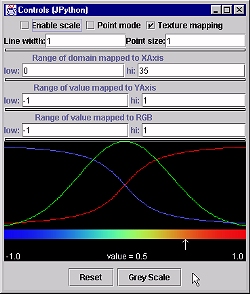
(Note that both these pictures have been reduced in size, and
therefore appear a little blurry.)
Instructions for using these are here (where?)
plot(Data d)
The most basic form. When used, the following other defaults are in
effect:
- window name - "Jython"
- show edit mappings dialog - false
- background color - white
In this case, since the "show edit mappings dialog" is false, then the
plot will attempt to automatically detect the mappings. Note:
in some cases, like navigated images, this may result in a very, very
long time to render the display since it will attempt to resample the
image into a linear latitude-longitude domain. In this case, you
probably want to use the plot(Data d, 1) form (see below).
plot(String s, Data d)
The most basic form. When used, the following other defaults are in
effect:
- window name - contents of String s
- show edit mappings dialog - false
- background color - white
plot(Data d, int showmap)
The most basic form. When used, the following other defaults are in
effect:
- window name - "Jython"
- show edit mappings dialog - (int=1, true; int=0, false)
- background color - white
plot(String s, Data d, int showmap)
The most basic form. When used, the following other defaults are in
effect:
- window name - contents of String s
- show edit mappings dialog - (int=1, true; int=0, false)
- background color - white
plot(Data d, int red, int green, int blue)
The most basic form. When used, the following other defaults are in
effect:
- window name - "Jython"
- show edit mappings dialog - false
- background color - color created from values of red, green, blue
plot(String s, Data d, int red, int green, int blue)
The most basic form. When used, the following other defaults are in
effect:
- window name - contents of String
- show edit mappings dialog - false
- background color - color created from values of red, green, blue
plot(String s, Data d, int showmap, int red, int green, int blue)
The most basic form. When used, the following other defaults are in
effect:
- window name - contents of String
- show edit mappings dialog - (int=1, true; int=0, false)
- background color - color created from values of red, green, blue
Specifying your own mappings
If you create your own scalar mappings (covered later on), you can use
the following forms:
plot(Data d, ScalaMap[] list )
plot(String s, Data d, ScalaMap[] list)
plot(String s, Data d, int showmaps, int red, int green, int blue, ScalaMap[] list)
Forms of clearplot()
clearplot()
If a default-named plot() has been done, the contents of the display
are cleared and the window is closed.
clearplot(String s)
If the plot named 's' exists, the contents of the display are cleared and
the window is closed.
Back to the home page