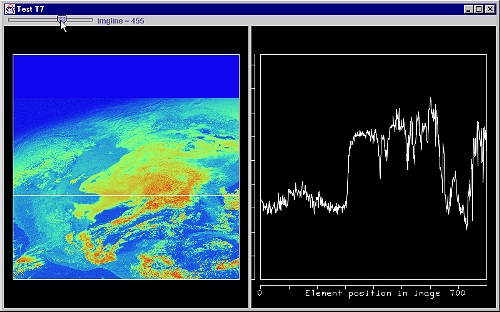
Here's what it looks like:
Note: Many of these examples will refer to a Jython script-in-progress named subs. This script is in the visad.python package, and you might want to refer to the source code at times.
image = load("../data/mcidas/AREA0001")
plot(image)
But, in this application, we also want to show the
pixel vs. brightness graph, on
the right side. How can we do that? There are three main
ingredients:
from visad.python.JPythonMethods import *
from visad import ScalarMap, Display

# read an image from a disk file
a=load("../data/mcidas/AREA0001")
print "Original type=",getType(a)

# get the domain and range types
d=domainType(a)
r=rangeType(a)
print d,"maps to",r

# refactor this to pull out the image line
f=domainFactor(a, d[1])
print "refactored type=",getType(f)

# connect domain and range components to display components
s=(ScalarMap(d[0], Display.XAxis),\
   ScalarMap(r[0],Display.YAxis),\
   ScalarMap(d[1],Display.SelectValue),\
   ScalarMap(d[1],Display.RGB))

plot("First",f,s)
When you run this, the following print-outs appear:
>>> execfile("refact.py")
Original type= ((ImageElement, ImageLine) -> Band1)
(ImageElement, ImageLine) maps to Band1
refactored type= (ImageLine -> (ImageElement -> Band1))
And the image that pops up in the plot window looks like:
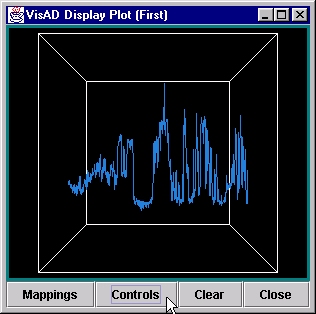
If you click on the "Controls" button, you'll get the VisAD Controls Widget:
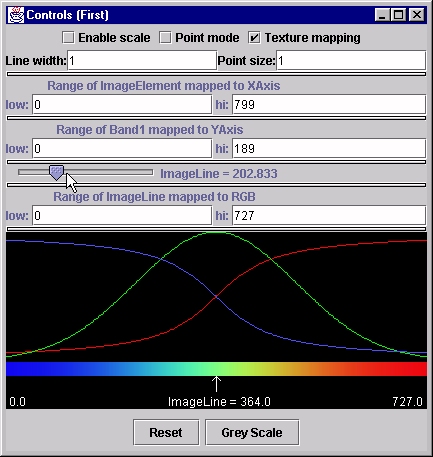
If you slide the "ImageLine" slider in the Control window, you'll see the graph change. How does that work?
The ScalarMaps in the example connect parts of the data to parts of the display. This is done in VisAD by using the Types of the components of the data. In this case, we first extract the domain types using the d=domainType(a). As the print-out shows, there are two components: (ImageElement, ImageLine). We want to map the first component to the X-axis of the display, and that's what the ScalarMap(d[0], Display.XAxis) does.
Furthermore, we want to map the brightness values to the display's Y-axis. These are really the first (and only) component of the range of the image, so we use: ScalarMap(r[0],Display.YAxis).
What we also want to test is that the ImageLine, which is the second domain component can be attached to the VisAD "select value slider" widget. That is done with the mapping: ScalarMap(d[1],Display.SelectValue). And just for fun, I also mapped the ImageLine to "RGB" (color) so as you move through the image, the color of the line on the graph will change. This is specified by saying: ScalarMap(d[1],Display.RGB).
m2 = subs.makeMaps(d[0],"x",r[0],"y",d[1],"selectvalue",d[1],"rgb")to define the mappings. This function simply connects components of the data to components of the display, much like the ScalarMap() in the above example.
Toward that end, we first have to learn how to display any VisAD Data object in our own window. In order to illustrate that, let's first show how to make a more-or-less generic Java window that we can put components into:
from visad.python.JPythonMethods import *
import subs
from javax.swing import JFrame, JPanel

a=load("../data/mcidas/AREA0001")
d = domainType(a)
r = rangeType(a)

s=subs.makeMaps(d[0],"x", d[1],"y",  r[0],"rgb")

disp = subs.makeDisplay(s)
ref=subs.addData("image",a,disp)

frame = JFrame("Test")
pane = frame.getContentPane()
pane.add(disp.getComponent())
frame.setSize(600,500)
frame.setVisible(1)
The first part of this is familiar -- we're just reading the data and
creating those "ScalarMaps" mentioned before. After that, though, we
do not employ the plot() method; instead, we create
our own display. The first two statements in this section:
d1 = subs.makeDisplay(s)
ref=subs.addData("image",a,disp)
first create a VisAD Display object, and then add some VisAD Data
object to the Display. Note that each of these returns a value: the
first returns a reference to the Display so it can be used in other
methods; the second returns a reference to the Data object that we
added to the Display.
At this point, now, we have a VisAD Display object and we need to simply add it to a Java Swing-based Window or Frame. The last 5 lines of the script above do just that. Each Java JFrame has a built-in pane onto which you can put components. The VisAD Display object we created has a getComponent() method that is used here to add it to the JFrame's pane. The last two statements simply resize the JFrame and make it appear on the desktop.
drawLine(disp, ( (100,100), (0,300)))This will draw a line from (100,0) to (100,300) in the coordinate system of the Display previously defined (mapped to x,y axes).
You might note that if you wanted to draw this line onto a display you generated with plot(), then instead of the display (disp) you would specify the name of the window (the default, by the way, is "Jython"):
drawLine("myframe", ( (100,100), (0,300)))
In this case, however, we not only want to draw the line, but we want
to be able to move it around. Therefore, we really need a separate
object to work with.
Since all display elements in VisAD are actually VisAD Data objects, it is necessary to first make up a VisAD Data object to represent the line. In this case, you probably want to define the "domain" to have the same types as the image; the "range" is just two (or 3) dimensional Jython list of points:
myline = subs.makeLine( (d[1],d[0]), ( (line, line), (0, max_element) ) )There is only one additional step: add the line into the display, just line you did the image previously:
lineref = subs.addData("line", myline, disp)
In the next section, we'll talk about extending this to create new
data every time we want to move the horizontal line. By de-coupling
these steps, we can then change the data values interactively...thus,
our line can be moved up and down.
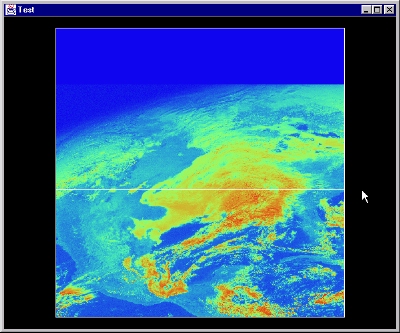
Before moving on, however, let's show the example of just putting this
horizontal line on the image, say at ImageLine = 321.
from visad.python.JPythonMethods import *
import subs
from javax.swing import JFrame, JPanel

# read the image and get the domain and range component types
a=load("../data/mcidas/AREA0001")
d = domainType(a)
r = rangeType(a)

# find out how many elements (pixels) in the image
numEles = getDomain(a).getX().getLength()

# connect the domain and range components types to Display types
s=subs.makeMaps(d[0],"x", d[1],"y",  r[0],"rgb")

# make a VisAD Display and add the image to it
disp = subs.makeDisplay(s)
ref=subs.addData("image",a,disp)

# make a horizontal line at ImageLine = 321, and add it as well
line = subs.makeLine( (d[1],d[0]), ( (321, 321), (0, numEles) ) )
lineref = subs.addData("line", line, disp)

# make a Java/Swing JFrame and put the VisAD Display into it
frame = JFrame("Test")
pane = frame.getContentPane()
pane.add(disp.getComponent())
frame.setSize(600,500)
frame.setVisible(1)
When you run this, the picture you get is:
In the code, below, we first define a DataReference that will connect a control widget (a VisADSlider in this case) to our Cell:
userline = DataReferenceImpl("userline")
slide = VisADSlider("imgline",0,LINES,0,1.0,userline,d[1])
And then we need to instantiate the Cell and then add a
Reference to the VisADSlider so the Cell's
doAction() method will be invoked when the slider changes:
cell = MyCell();
cell.addReference(userline)
The actual inner class that defines MyCell looks like this (and...note that this code snippet must actually appear before the reference to MyCell above):
class MyCell(CellImpl):
 def doAction(this):
  line = (LINES-1) - (userline.getData()).getValue()
  pts = subs.makeLine( (d[1], d[0]), ((line,line),(0,NELE)))
  usref.setData(pts)
  ff = byline.evaluate(Real(line))
  ref2.setData(ff)
This class extends CellImpl and contains only one method -- doAction() which is called whenever the slider changes. It then creates the coordinate values for the line to be drawn, replaces the previous values (using the usref.setData(pts), and then fetches a new set of values for the right-hand plot (using evaluate() to make a new set of values, and then ref2.setData(ff) to cause the right hand display to change).
from visad.python.JPythonMethods import *
import subs
from visad.java2d import *
from visad import DataReferenceImpl,CellImpl,Real, AxisScale

from visad.util import VisADSlider
from javax.swing import JFrame, JPanel
from java.awt import BorderLayout, GridLayout, Font

image = load("../data/mcidas/AREA0001")
#image=load("adde://image?")
print "Done reading data..."

dom = getDomain(image)
d = domainType(image)
r = rangeType(image)

# max lines & elements of image
NELE = dom.getX().getLength()
LINES = dom.getY().getLength()

# subs for image in display-1
m = subs.makeMaps(d[0],"x",d[1],"y",r[0],"rgb")
d1 = subs.makeDisplay(m)
subs.setBoxSize(d1,.80)
# add the image to the display
refimg = subs.addData("image", image, d1)

# now the second panel
m2 = subs.makeMaps(d[0],"x",r[0],"y",d[1],"selectvalue")
d2 = subs.makeDisplay(m2)
subs.setBoxSize(d2,.80)

# get the desired format of the Data (line->(element->value))
byline = domainFactor(image,d[1])
ref2 = subs.addData("imageline", byline, d2)

# also, set up a dummy reference so we can put the line onto the display
usref = subs.addData("line", None, d1)

# define an inner-type CellImpl class to handle changes
class MyCell(CellImpl):
 def doAction(this):
  line = (LINES-1) - (userline.getData()).getValue()
  pts = subs.makeLine( (d[1], d[0]), ((line,line),(0,NELE)))
  usref.setData(pts)
  ff = byline.evaluate(Real(line))
  ref2.setData(ff)

# make a DataReference that we can use later to change the value of "line"
userline = DataReferenceImpl("userline")
slide = VisADSlider("imgline",0,LINES,0,1.0,userline,d[1])

cell = MyCell();
cell.addReference(userline)

# change the scale label on x axis
xscale=AxisScale(m2[0],label="Element position in image")
showAxesScales(d2,1)

# display everything...
frame = JFrame("Test T7")
pane = frame.getContentPane()
pane.setLayout(BorderLayout())
panel = JPanel(GridLayout(1,2,5,5))
panel.add(d1.getComponent())
panel.add(d2.getComponent())
pane.add("Center",panel)
pane.add("North",slide)
frame.setSize(800,500)
frame.setVisible(1)