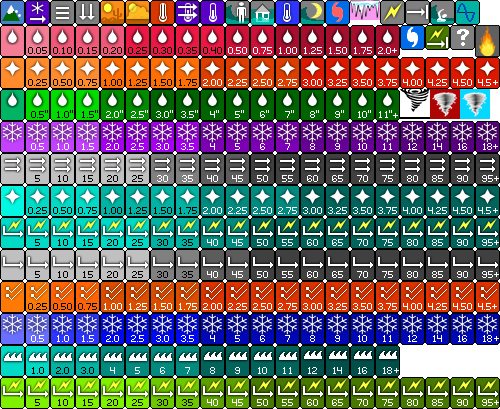
Click here to see the 'spritesheet' image.
The sprites= parameter in the config file looks like this:
sprites=lsrsprite.png, row, 14,25,25, 1,30,20, 4,25,25, row, 16,25,32, 3,25,25,1,25,32, row, 20,25,32, row, 16, 25,32, 3,30,30, row, 20,25,32, row, 20,25,32, row, 20,25,32, row, 20,25,32, row, 20,25,32, row, 20,25,32, row, 20,25,32, row, 16,25,32, row, 20,25,32
One of the hotspot parameters in the fof_extension file looks
like this:
hotspot=301.33,179.73,sprite,199,pan/1,popup,<br>Event: SNOW<br>Mag: Measured 0.2 INCH<br>Time: 14 Dec 2016 at 08:00 CST<br>City: 2 WSW CONIFER CO<br>County: JEFFERSON<br><br>Source: COCORAHS<br>Remarks: ,Measured 0.2 INCH SNOW
The LSR display has been linked to overlay #1 ("LSR") and we use the 2nd overlay to display watches and warnings. Note that overlay #1 is an image that just contains some text showing that it is visible and to illustrate that the "hotspot" icons are displayed on top of the image.
We continue to use the "tooltip" of the hotspots and hotzones to display abreviated information, with details being shown when the user clicks on the spot or zone.
So....first enable the "LSR" overlay, and then hover over some of the icons. Click them to get a pop-up with details. Note also when you zoom in that the icons remain the same size and will separate the more you zoom in...
The icon images in the spritesheet are Copyright© 2016 by StormQuest Technologies, and is used here by permission.