![]()
![]()
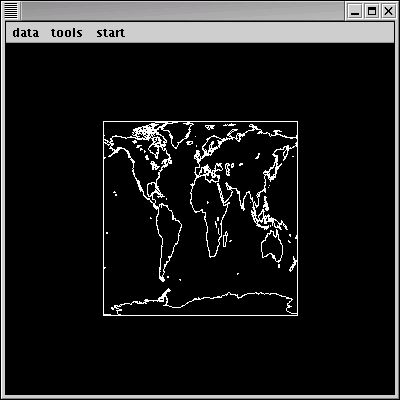
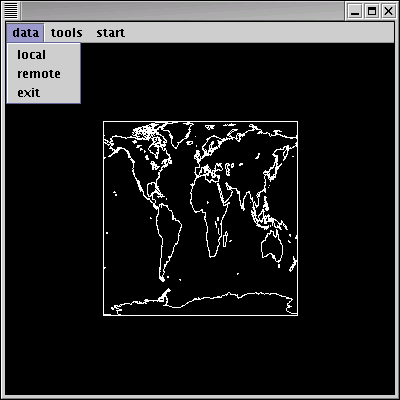
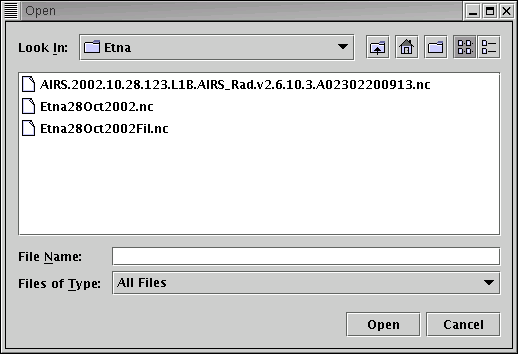
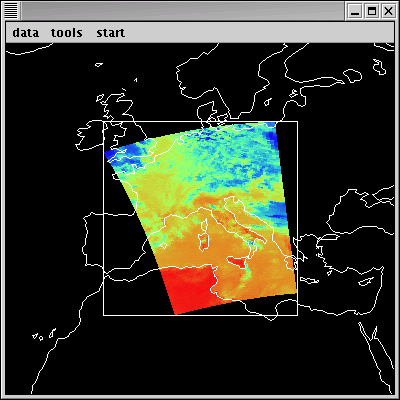
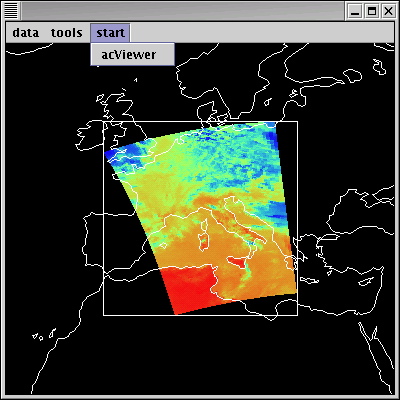
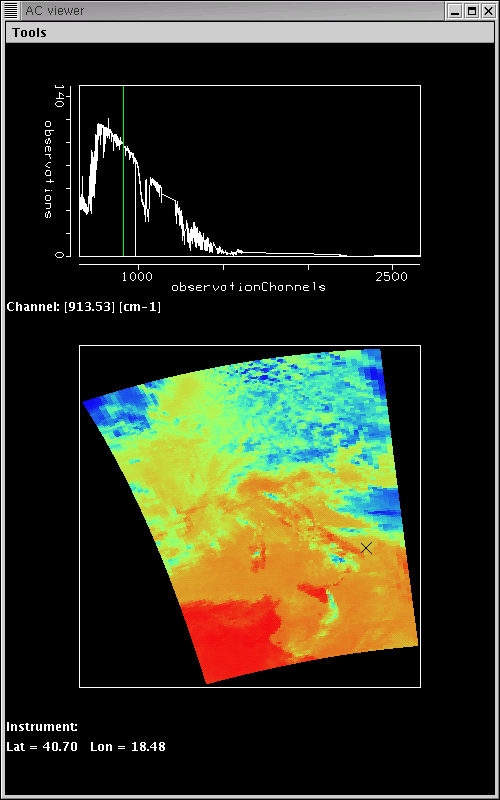
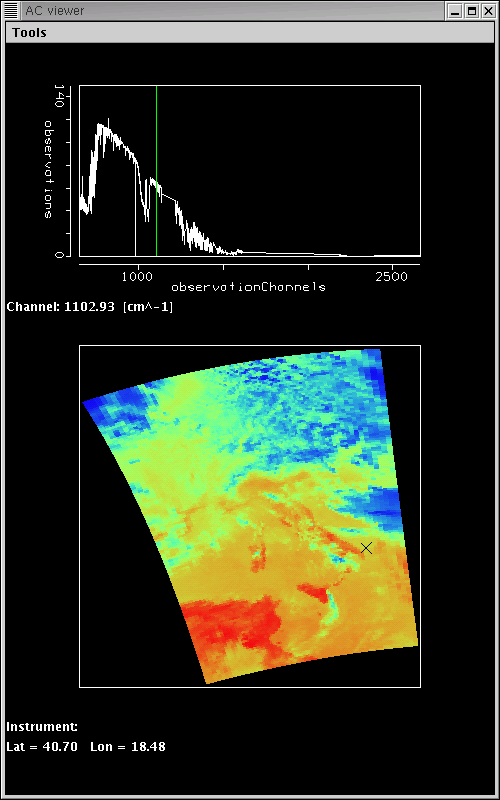
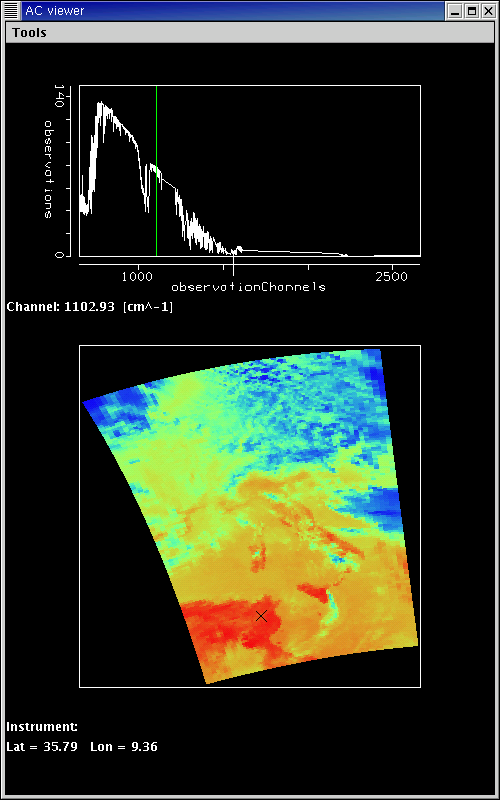
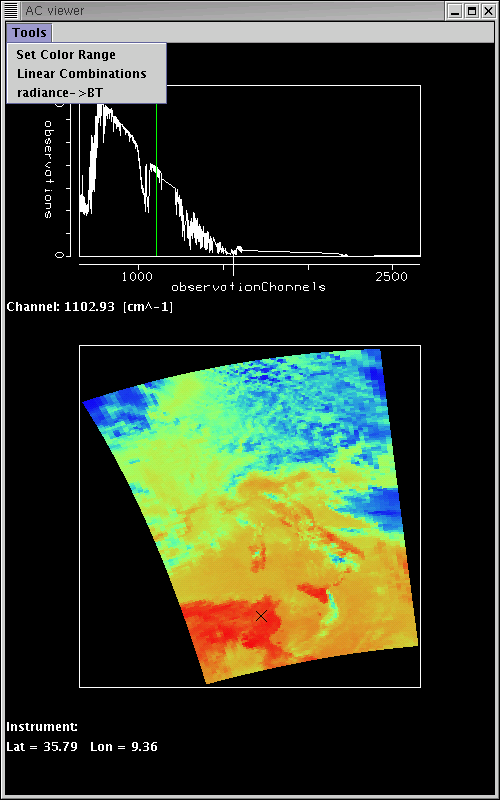
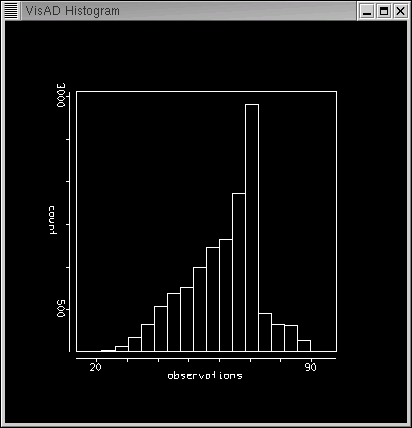
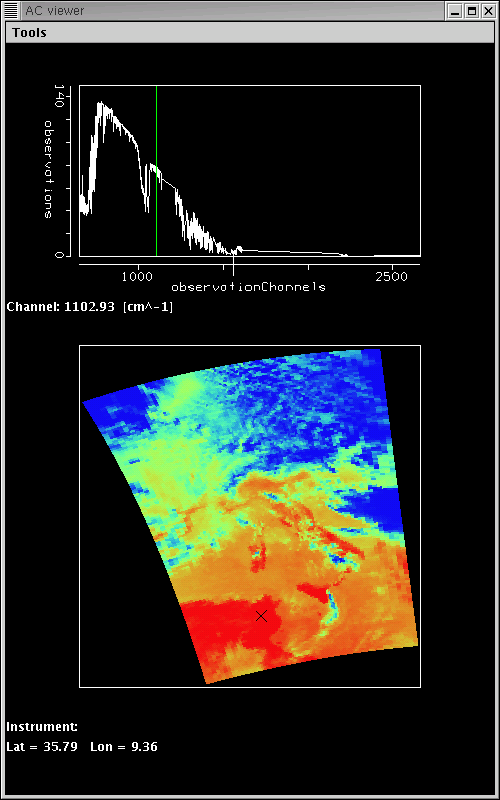
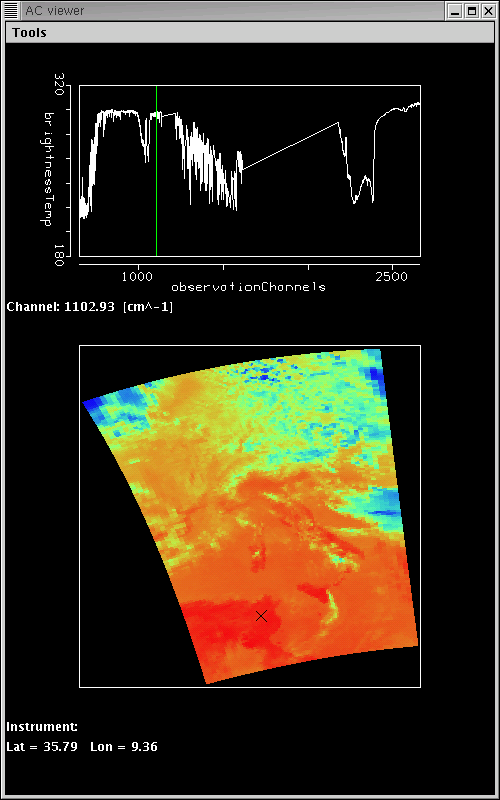
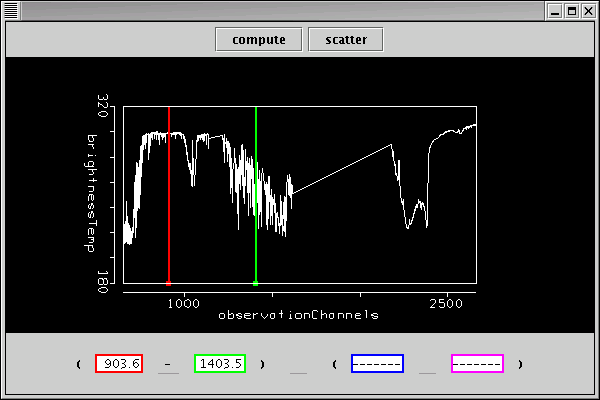
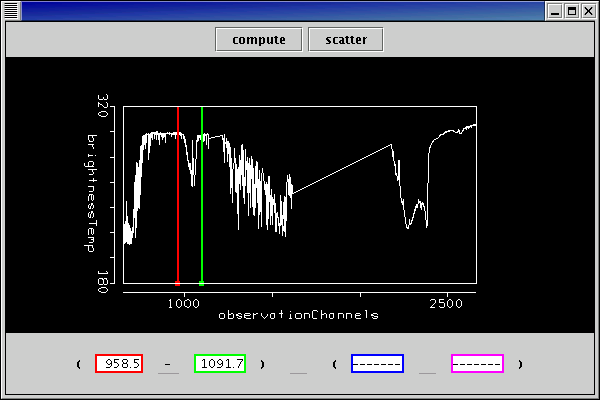
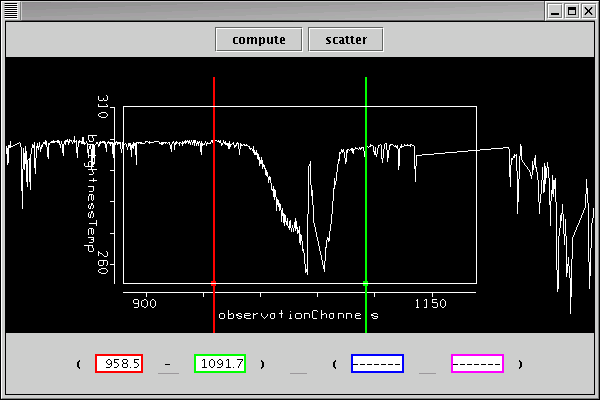
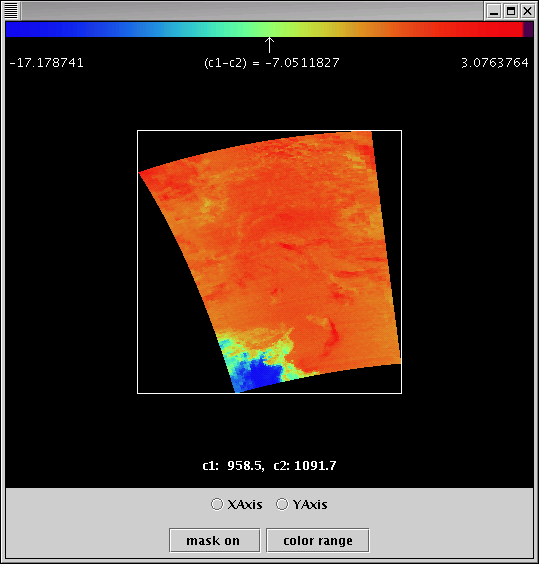
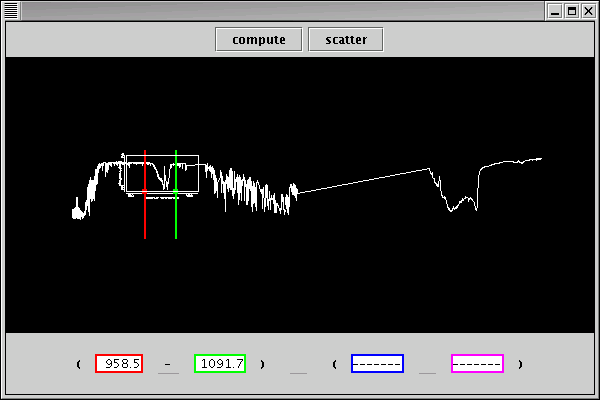
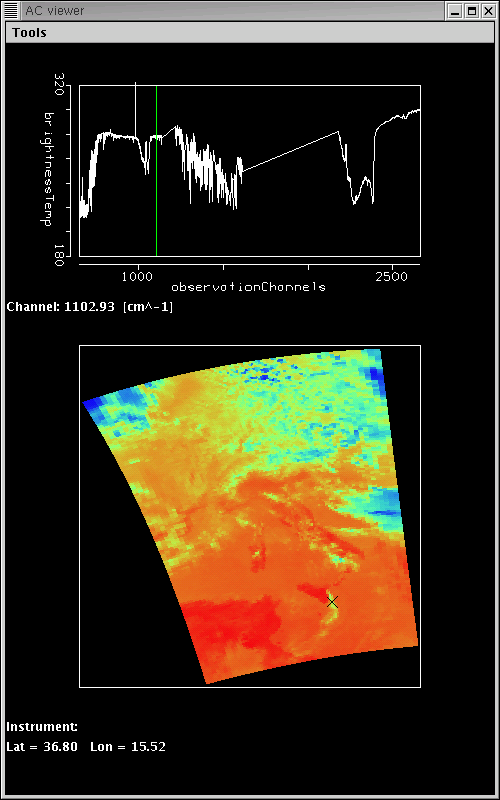
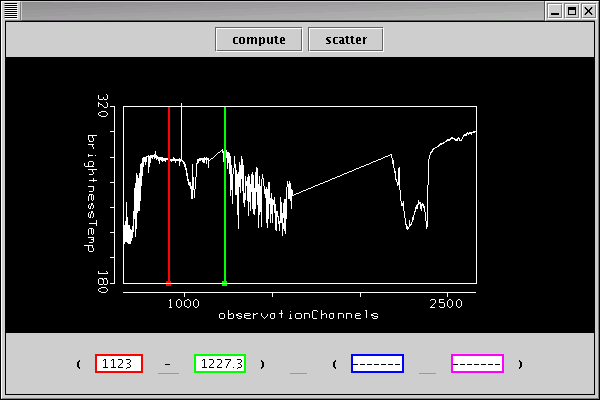
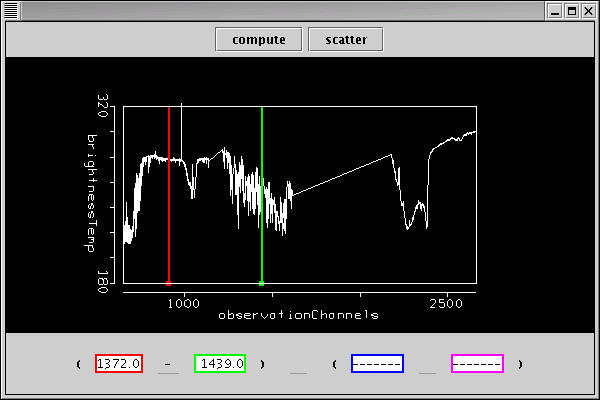
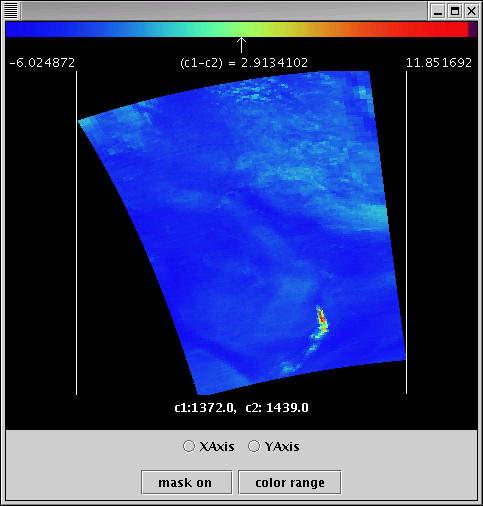
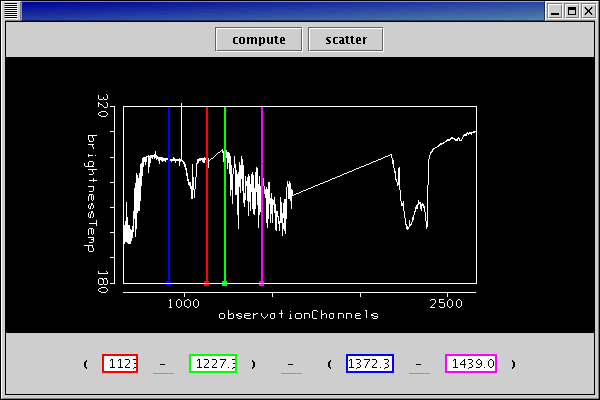
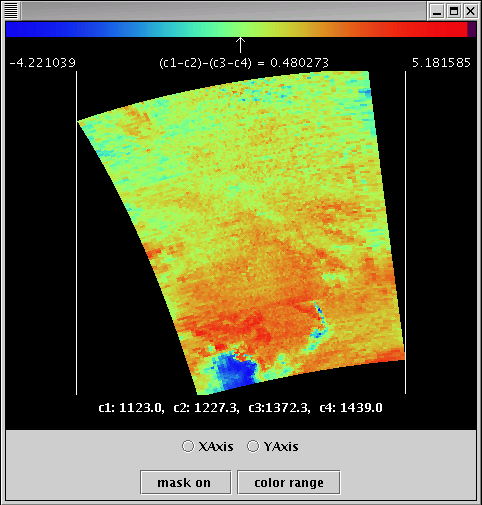
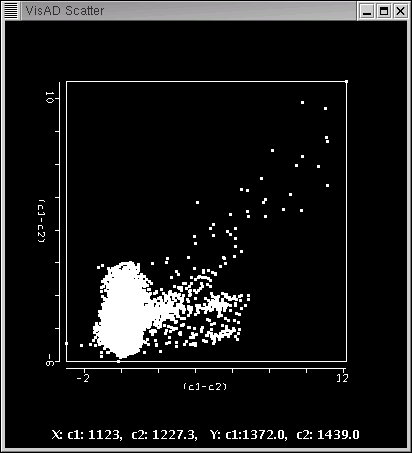
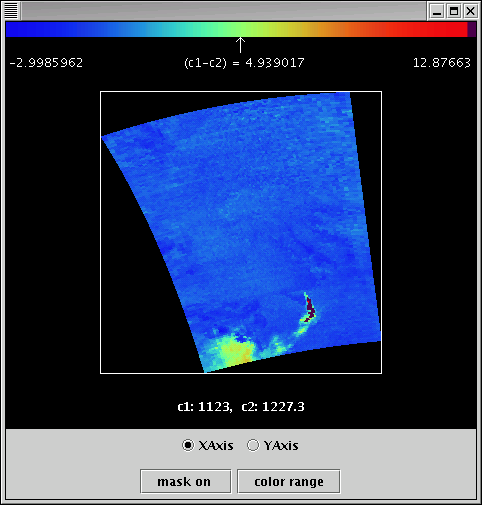
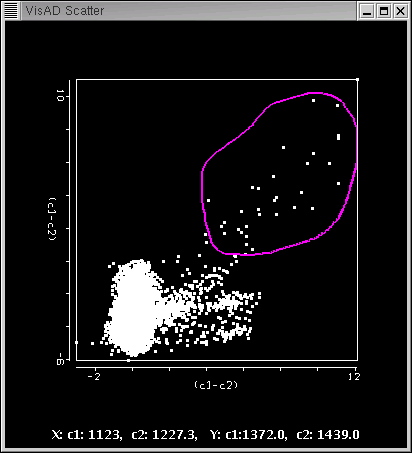
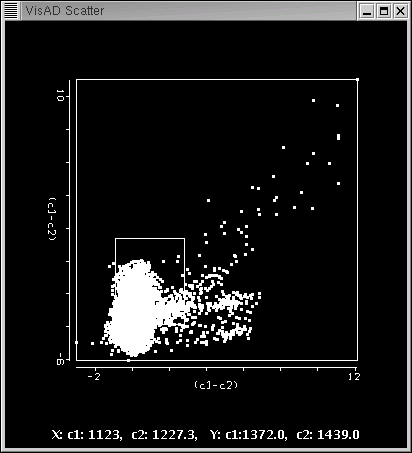
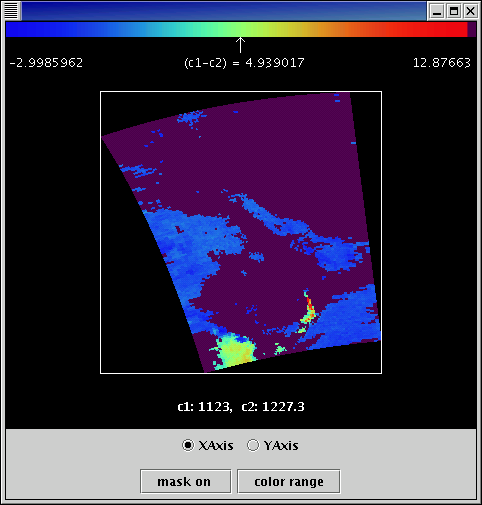
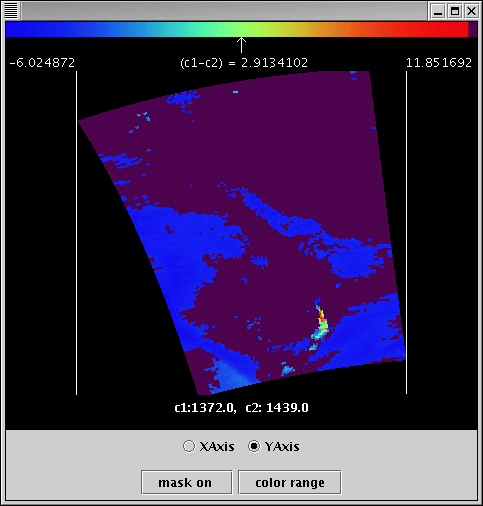
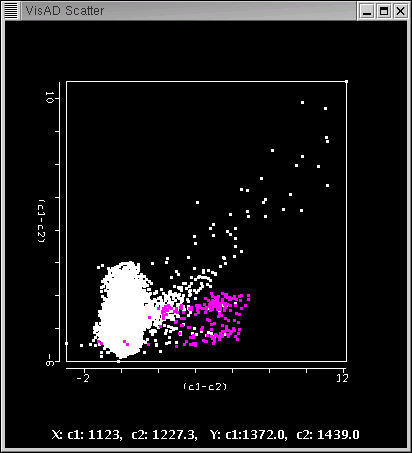
Open Hydra Type ./runHydra Get Main Menu Options Read Local Files Select Local Select Local AIRS data (netcdf hydra format) The image of the AIRS granule will pop up the window Open acViewr acViewer Display Click Left Mouse Button on the Spectrum to Channel The main scene will change Simultaneous Click of Left and Right Mouse Buttons on the scene to change FOV The Spectrum will change Click on Tools Menu Select "Set Color Range" Change Color Scale: Click on the Left Mouse Button on the Left Side of the Histogram and then on the Right side to Clip the Histogram and Chance the Color Scale Color Scale has changed From the Tools Menu Convert Radiance to Brightness Temperatures BT Now the Spectrum and the Scene are in BT From the Tools Menu Select "Linear Combinations" of Channels Either Click with the Right Mouse Button on the Green and Red Boxes at the Bottom of the Green and Red Vertical Lines and Drag Them, OR .Enter the desired values in the Boxs. Enter 958.5 and 1091.7 CTRL+Right Mouse Button (drag) to Select the Spectral Region you want to zoom in Click on "Compute" Button. A Pseudochannel Window will pop up Showing the image obtained by the Linear Combination of the the Selected Channels. Go back to the Display with the Specturm and SHIFT+Left Mouse Button (drag forward and bakward to Zoon in and out), CTRL+Right Mouse Button to Select the Spectral Region to Zoom in. Simultaneous Click of Left and Right Mouse Button on the acViewr Scene Display: Pick a Pixel on the Volcanic Smoke Plume In the Select Channel Display Enter the following channels: 1123 and 1227.3 Click on the "Compute" Button. This combination gives you the aerosoles distribution In the Select Channel Display Enter the following channels: 1372.3 and 1439 Click on the "Compute" Button. This combination gives you the SO2 distribution In the Select Channel Display Enter the following channels: (1123 - 1227.3) - (1372.3 - 1439) Click on the "Compute" Button. This combination gives you the aerosoles (no SO2) distribution In the Aerosoles Window Select "X Axis" and in the SO2 Window Select "Y Axis" and then in the Channel Combination Window Click on the "Scatter Plot' Button. The Scatter Plot has the (1123 - 1227.3) Combination on the X axis and the combination (1372.3 - 1439) on the Y axis. CTRL+Right Mouse Button (drag) to draw a line to select a region in the Scatter plot Window. The Points Selected in the Scatter plot Window will turn Magenta in the Pseudochannel Windows. CTRL+Right Mouse Button (drag) to draw a line to select a region in the Pseudochannels Window and the selected points will turn Magenta in the Scatter Plot Window. SHIFT+Right Mouse Button (drag) to draw a line to select a region in the Scatter plot Window. The Points Selected in the Scatter plot Window will turn Magenta in the Pseudochannel Windows. SHIFT+Right Mouse Button (drag) to draw a line to select a region in the Pseudochannel Windows.. The selected points will turn Magenta in the Scatter Plot Window.
![]()
If you have comments or suggestions,
email me at paoloa@ssec.wisc.edu
![]() back
back
![]() Home
Home