
| |
Upper Midwest Radar Help |
A measurement of the location and intensity of precipitation. "Reflectivity" is the amount of transmitted power returned to the radar receiver, measured in dBZ (decibels of Z, where Z represents the energy reflected back to the radar). Used to detect precipitation, evaluate storm structure, locate atmospheric boundaries and determine hail potential. More information.
Estimated accumulated rainfall, continuously updated, since the last one-hour break in precipitation. This product is used to locate flood potential over urban or rural areas, estimate total basin runoff and provide rainfall accumulations for the duration of the event. More information.
This interactive applet enables you to extrapolate or "forecast" the flow of weather to a particular location by selecting a feature that is representative of the flow of other features that may be heading your way. E.g., Find an easily selectable feature such as a dry line. Select the dry line in a couple of frames, then click control (Ctrl) and right mouse button over a location, like Madison. The line extending from the location that you selected will have times on it. Features like storm cells or dry lines along the line will reach your location at the time that is stamped. Please follow the directions below.
Unlike other tracking programs, this applet lets you know what sort of weather will arrive at a particular location and when. You are not necessarily trying to track the motion of a particular storm.
Instructions:When you mark a feature, you may find it easier to use one of the endpoints of the marker cross-hair, rather than the center which may obscure the feature or important nearby clues.
When you "forecast" by moving the mouse pointer over a location and click the button while holding the Control (Ctrl) key down, the line that is drawn on the screen is forward in time but backwards in space, so that you see (given the movement you defined) what will arrive at the destination point and when....assuming persistence, of course!
When you use this, you are not extrapolating the movement of the feature you track; rather, you are using that feature to obtain a “ representative motion” of everything in the field. The vector that is drawn when you want to forecast will show you (based on linear extrapolation) what, if anything, will arrive at the position you put the cursor at; it may, or may not, have any thing to do with the feature you tracked (except for the motion). The idea is to find out what will arrive at a particular point (like your city) and when. It is not to answer questions like “where is that thunderstorm going?” (although, it can be used for that).
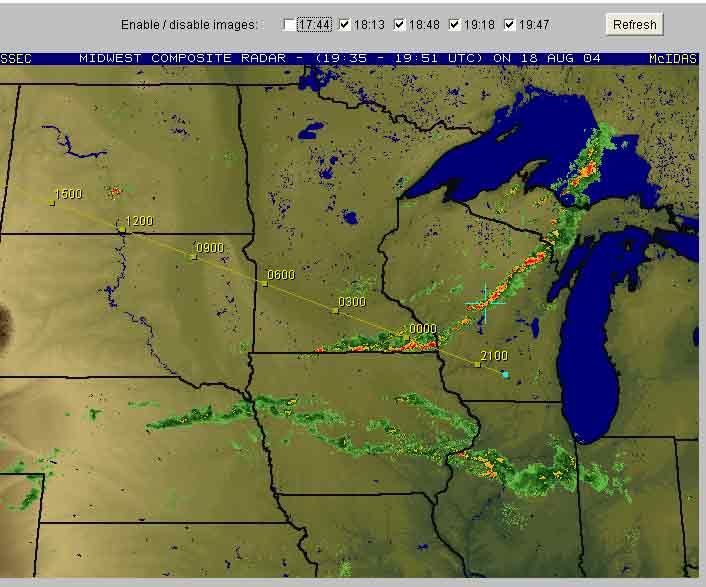
Example 1:

This line of storms will reach the location on the image marked by the little
blue square (the right end point of the yellow line) at about 21:00
UTC because this where the yellow line intersects
this line of storms.
Example 2:
This line of storms will reach the location on the image marked by the little
blue square (the right end point of the yellow line) at about 22:00
UTC (the front edge is between 00:00 or 24:00 UTC and 21:00 UTC, but
closer to 00:00 UTC). Notice that in this particular instance, we used a feature
of this storm system that will not directly hit our marked location - you do
not have to try to track the particular part of the storm that you think is
going to move over your interested location.
Disclaimer: use at your own risk. We make no claims as to the accuracy or suitability of this applet for your particular application. By using this, you agree to hold us harmless. The Extrap applet is Copyright(c) 1998 by Tom Whittaker.
Select this option if you wish to view the radar images using an alternate color scale that has more contrast between the different levels.
These images are a combination or composite of the "Base Reflectivity" data from all of the radars in the Upper Midwest. This is the reason that the products "Radial Velocity" and "Storm Total Precipitation" are not available for the option "Midwest composite".
Select this option if you wish to view the latest image without downloading all of the overlays and without using the Java applet, AniS (used to provide the ability to overlay maps, zoom, animate ...). This will speed up the downloading and will also allow people without Java installed to view the latest radar image. The options "Animate" and "Forecast Storm Movement" require Java and so this option is not available in conjunction with those options.
Select this if you wish to use cookies so that your browser remembers and displays what you were last viewing next time you visit this page.
Use this button if you wish to save the currently viewed image to your computer, by opening a separate window with just the radar image displayed.If viewing an animation, you must click on the "Stop" button first to stop the animation to use this button.
Use this button to zoom into the radar image. When the 'zoom' button is clicked, the cursor will change shape. When you click with the left button on the image, it will be zoomed one factor (x2, x3, x4...) at the cursor location. After the first zoom, the button will be relabelled "reset". You may then 'roam' the image around by dragging the mouse. More left-clicks will zoom in farther; right-clicks will zoom out one step per click. If the "reset" button is clicked, the image will be restored to the original.
This button will attempt to force a reload of the images, ignoring any cached images.
This button is used to control whether a movie loop or a rock back-and-forth mode is used when viewing an radar animation.