McIDAS-X Learning Guide
Version 2020
[Search Manual]
[Table of Contents]
[Go to Previous]
[Go to Next]
GUI - Plotting Surface and Upper Air Data
In this exercise, you will plot real-time surface and upper
air observations (Please note that these two GUIs currently only work for real-time
data, even though all MD datasets are listed under the dataset menu button).
- Switch back to looping all frames, and erase the image and graphics in all six frames.
Select: Show Frame/ALL FRAMES/1
Click: Erase Image 
Click: Erase Graphics 
Click: Advance Frame 
Repeat process until all six frames (1-6) have been erased.
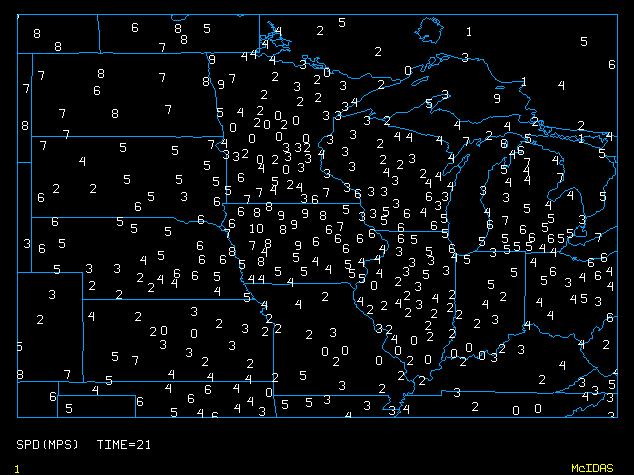
- Display the current wind speeds on frame 1. Display the data in meters per second over the Midwest using the dataset RTPTSRC/SFCHOURLY. Display a sky blue map with white label colors.
Select: Display/Real-time Surface Data
Select: Select Frame/ALL FRAMES/1
Select: Dataset/RTPTSRC/SFCHOURLY, Parameter/Wind Speed, Units/Wind/MPS, and Time/Current Time
Click: Today's Date
Click: Options Tab
Select: Map Boundaries/MID
Select: Map Color/SKY
Select: Label Color/WHITE
Click: Load Point(s)
The plot should look similar to this:
- Now, look at the map and find the state with the highest wind speed.
Use that state when defining the map to display the wind gusts on frame 2.
Click: the Data tab
Select: Select Frame/ALL FRAMES/2
Select: Parameter/Wind Gusts
Click: the Options tab
Select: Map Boundaries/the state you chose
Click: Load and Dismiss
- Erase the graphics from the first two frames using the method in step 1 above, and bring up the DISPLAY/Real-time Upper Air Data GUI.
- Using the method described above, display today's 0 UTC 500 mb temperature from the RTPTSRC/UPPERMAND dataset over the United States.
- Dismiss the Real-time Upper Air GUI.
[Search Manual]
[Table of Contents]
[Go to Previous]
[Go to Next]