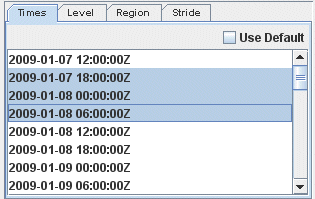
Image 1: Times Tab of the Subset Panel in the Field Selector
The Data Subset panel contains tabs for subsetting Times, Levels, Region, and Stride. These tabs may be different depending on what data you are loading.
Optionally subset the times by clicking off the Use Default checkbox and selecting the times. You can select individual times to display with Ctrl+click or Shift+click. Alternatively, you can subset the times by right clicking in the panel and selecting 'Select every N'th time'. This automatically subsets the times by only selecting every N'th time. The Use Default checkbox will utilize every available time in the display:
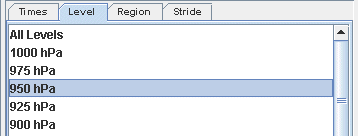
For 3D grids, you can optionally subset the levels. This represents the level in the atmosphere that will be used to plot the data in the Main Display window:
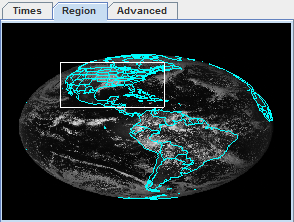
For images, optionally subset the spatial area to be displayed. Use the Region tab to left-click and drag to select a geographical region to display. In the Main Display window, the display will be centered around your box and no data will be plotted outside of it. Note that before subsetting a region, you may have to uncheck the Use Default checkbox:
Use the Advanced tab to further refine your data selection and refer back to the Region tab to view the image you've selected:
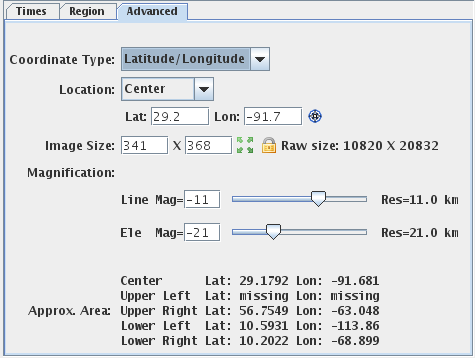
The image properties in the Advanced tab allow you to override the default properties McIDAS-V uses to specify aspects of the image data. The widgets show the defaults McIDAS-V will use. By changing any of the widgets you can override the default value.
Use the Stride tab to change the number of points used to create the image. You can utilize fewer points along the X and Y-axes to display the data faster, but with less precision. It is recommended to leave the X and Y values as their default (All points) unless you are trying to get a general picture and nothing too specific.
Use the Settings tab to utilize any display settings you may have set.
The Subsetting component of the Field Selector allows you to subset the data in both time and space (if possible). If there are times in the data source you are viewing they will be shown in this area. Likewise, if it is possible to do spatial subsetting or decimation a Spatial Subset tab will be shown.
Time and spatial subsetting defaults can be applied to the data source itself through the Data Source Properties dialog or the defaults can be overwritten through the Field Selector tab.