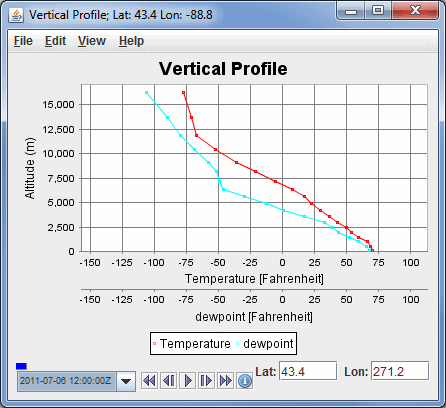
Image 1: Vertical Profile Display
The Vertical Profile display is an available display type for 3D model data that plots the value of any number of fields versus altitude. For more information on this display type, see Vertical Profile Controls.

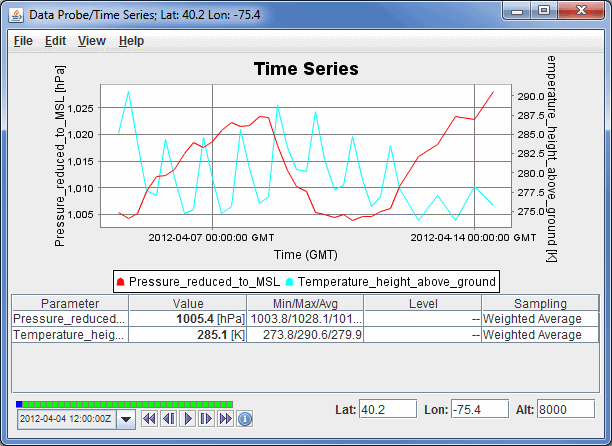
The Data Probe/Time Series display plots in the Layer Controls tab of the Data Explorer, and plots a line that represents the numerical value of the parameter (Y-axis) at a given time (X-axis). You can change the location of the probe in the Main Display window by left-clicking and dragging it. See Data Probe/Time Series for more information on this display.

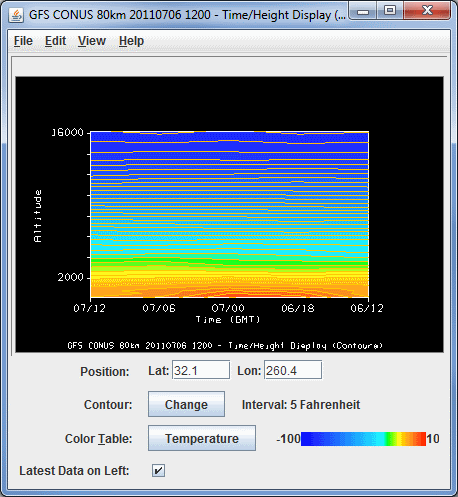
A Time/Height display plots a field's value in the vertical through the progression of time, with altitude on the Y-axis, and time along the X-axis. This can be a Contour or Color-Shaded display. For more information on this display type, see Time/Height Controls.
