The Point Data Plot Control displays a set of observations using a layout model. This control is accessed by selecting the Point Data field and the Point Data Plot display. The control window consists of four tabs: Layout, Times, Plot, and Filters.
The Layout tab allows you to control basics of the display:
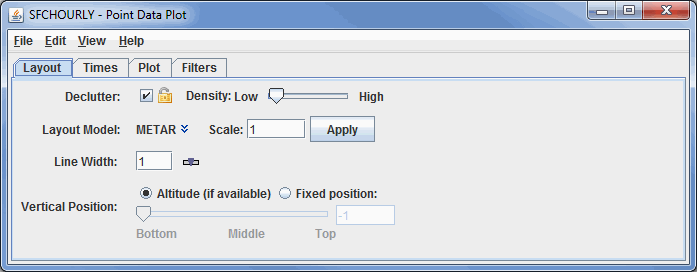
Image 1: Layout Tab of the Point Data Plot Controls Dialog
- Declutter - Displays only stations that do not overlap when selected. When unchecked, all of the stations will be shown, and the Density slider will be grayed out. The small "lock" icon allows you to lock the stations that are currently being displayed and not have their display changed when navigating in the Main Display window.
- Density - Changes how dense the display of stations is in the Main Display window when the decluttering option is selected. This option will not be available if the decluttering option is not selected, as all of the stations will then be displayed.
- Layout Model - Sets the layout model that will be used to display the data. This can be one of the native layout models included with McIDAS-V, or a user-made layout model. Click on the downward facing blue arrows
 to change the layout model. Selecting Edit will open the Layout Model
Editor which will allow you to create your own custom layout model.
to change the layout model. Selecting Edit will open the Layout Model
Editor which will allow you to create your own custom layout model. - Scale - Sets the size of the layout model displayed in the Main Display window.
- Line Width - Sets the thickness of the layout model displayed in the Main Display window.
- Vertical Position - Sets the vertical positioning of the layout model with respect to other variables being displayed. The Altitude option will set the vertical position of the layout models based off of the stations' altitudes (if this information is available through the data source). The Fixed Position option will uniformly set a fixed vertical position for each layout model regardless of altitude. The value for a fixed position can be set using the slider or entering a value into the field and pressing Enter.
The Times tab allows you to change the observation times that are shown in the display. By default, data for a single time corresponding to the current animation time will be shown. Using this widget allows you to show data from multiple times at once:
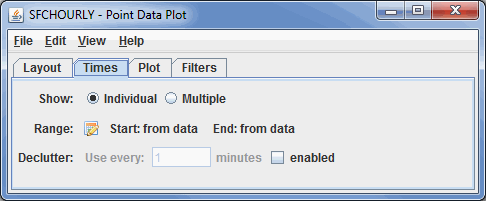
Image 2: Times Tab of the Point Data Plot Controls Dialog
Clicking ![]() opens a Time Settings window that allows you to select specific start and end times:
opens a Time Settings window that allows you to select specific start and end times:
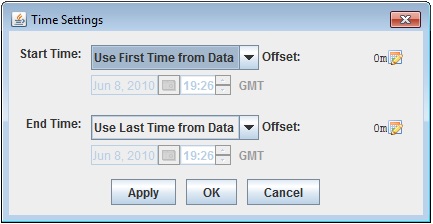
Image 3: Time Settings Dialog
- Show - Displays the data on individual frames in the Main Display window with respect to the time of the data, or plots all of the data on every frame regardless of the time of the data.
- Range - Changes the initial and final date and time to display in your loop.
- Declutter - Subsets the data that is being displayed by only showing every N minutes. This is generally not useful for observation data (e.g., station data). However, for observation data that contains many times (e.g., airplane track data), you can use this field to subset the times. Selecting the enabled checkbox allows you to set a number of minutes.
- Note: If you are displaying point data that has a large number of times, you will be prompted whether you want to view all of the times. This is often the case with satellite data, where each data point can have its own timestep. As an alternative to adjusting the time controls above, time binning can be applied to the data source before the display is created to group multiple times of data into the same timestep.
The Plot tab provides a time series chart and a data readout table of a selected station. To use this, left-click on a station in the main display. Double-click or right-click and select Add To Chart on a table row to add it to the time series chart. See the Charts page for more information about customizing the chart:
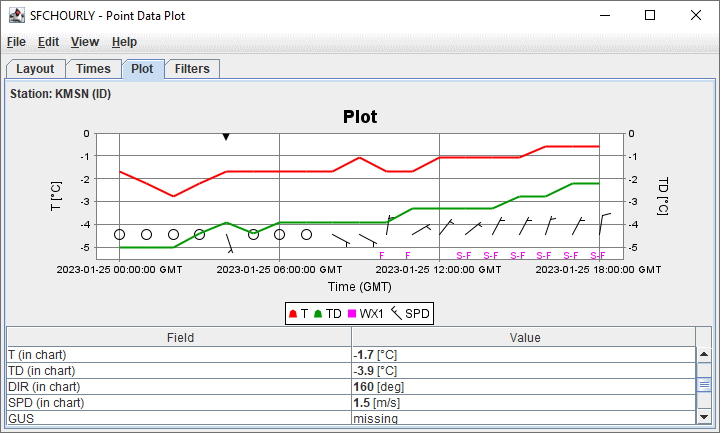
Image 4: Plot Tab of the Point Data Plot Controls Dialog
- Station - Shows the station for which the data is being displayed. This can be changed by left-clicking on a different layout model in the Main Display window.
- Field - Lists the different fields available from your data source that you can select from to display in the plot.
- Value - Lists the numerical value of the Field at the time selected.
The Filters tab allows you to set individual or multiple filters to specify which data are shown in the Main Display window:
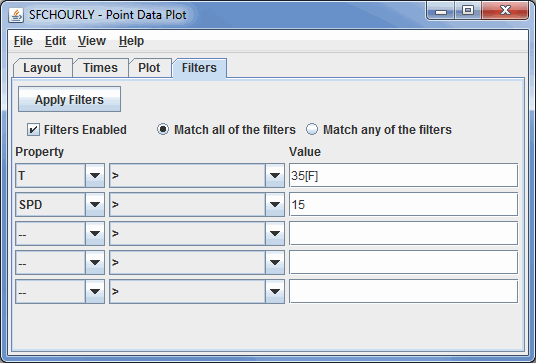
Image 5: Filters Tab of the Point Data Plot Controls Dialog
 - Applies any set filters to the data displayed in the Main Display window.
- Filters Enabled - Enables filters to be applied to the data in the Main Display window.
- Match all of the filters - Displays only layout models that correspond with every chosen filter.
- Match any of the filters - Displays any layout models that correspond with one or more of the chosen filters.
- Property - Represents the variable or property that you want to filter.
- Middle Dropdown Menu - Represents the mathematical symbol that determines your filter. This can be greater than, less than, equal to, not equal to, etc.
- Value - Specifies the numerical value that the mathematical symbol in the middle dropdown menu will utilize.
As an example, the above image shows two filter expressions, one that states the Temperature Property needs to be greater that 35 F and the other states that the Wind Speed value needs to be greater than 15. The unit of [F] is entered for the Temperature Property. If you do not define a unit after the value, then McIDAS-V will utilize the native unit for the Property. Match all of the filters is selected, meaning only layout models where the Temperature is greater than 35 degrees F and the wind speed is greater than 15 will be plotted in the Main Display window.
Many of the menu items seen utilizing this display are standard options that can be found in the Menus section of the Layer Controls page. However, there are some options that are unique to this display.
The File menu has these unique options:
- Save Chart Image... - Saves an image of the chart produced in the Plot tab.
- Export to KMZ... - Exports the data in the (*.kmz) format.
- Export Selected Observation... - Exports the data in the Comma-Separated Values (*.csv) format.
The Edit menu has this unique option:
- Layout Model... - Opens the Layout Model Editor which will allow you to create your own custom layout model.
The View menu has these unique options:
- Use Projection From Observations - Re-centers the display and resets the zoom level back to the display's initial settings without changing any other preferences you have modified.
- Enable Adaptive Resolution (Under Development) - Turns adaptive resolution on or off for the layer. This menu item is only available if adaptive resolution is enabled in the User Preferences. Note that adaptive resolution is still under development.
- Chart - Allows you to display a thumbnail of the chart in the Legend, change the Grid Layout, zoom in and out, save the chart, and open the Plot Properties window.
- Show Raw Data - Displays the data in its raw format in the Value menu of the Plot tab before any rounding/formatting is done to the data by McIDAS-V.