Overview
The Grid Table display in creates a table in the Layer Controls tab of the Data Explorer. This chart plots the numerical value of the selected field at every latitude and longitude point. The user can change the order of the items in this chart by Latitude, Longitude, or field values by clicking on the title of the respective column in the table. This will change the order of the table to go from lower to higher values, or higher to lower values.
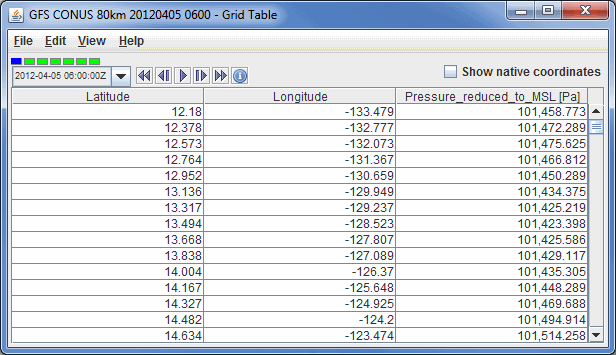
Image 1: Grid Table Display
Properties
 Time Animation Controls - Controls the looping of data through time. For more information, see Time Animation.
- Show native coordinates - Lists X/Y values instead of Latitude/Longitude values.
Menus
All of the menu items seen utilizing this display are standard options that can be found in the Menus section of the Layer Controls page.