The Vertical Profile Display Control shows a plot of any number of field values versus altitude (or pressure if the Vertical Profile (Pressure) display type is used). See the Charts page for more information about customizing the chart. In order to use the Vertical Profile display, the parameter must be 3D data.
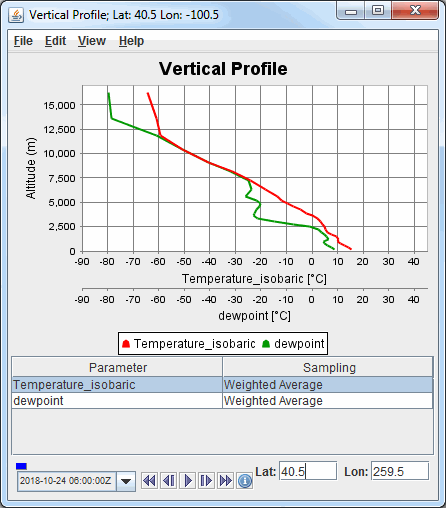
Image 1: Vertical Profile Controls Display Window
- Parameter Table - Lists the parameters plotted in the vertical profile. Right-clicking on an item allows for adding additional parameters to the chart and accessing the Properties window of a specific parameter.
- Position - Displays the map position of the vertical profile is indicated by the "Lat:
Lon:"
readout below the graph. Enter in a value in the Lat and/or Lon fields and press Enter to set the value to move the location of the probe.
The map position of the profile is shown in the Main Display window by a colored vertical line. There is a Selector Point on top of the vertical line. The vertical profile line can be moved by dragging the Selector Point with the left mouse button.
 Time Animation Control - Controls the looping of displays through time.
See more in Time Animation Control.
Time Animation Control - Controls the looping of displays through time.
See more in Time Animation Control.
Many of the menu items seen utilizing this display are standard options that can be found in the Menus section of the Layer Controls page. However, there are some options that are unique to this display.
The File menu has these unique options:
- Save > Export Current Time as CSV... - Exports the currently displayed time to a CSV file. All displayed variables will be written to the file.
- Save > Export All Times as CSV... - Exports all displayed times to a CSV file. All displayed variables will be written to the file.
The Edit menu has these unique options:
- Selector Color - Changes the color of the shape representing the location of the probe in the Main Display window.
- Add Parameter... - Opens a Field Selector window with the option to add another parameter to the display from one of the loaded Data Sources.
The View menu has these unique options:
- Parameters - Provides access to the Chart Line Properties window for each parameter, change the unit of the displayed parameters, and the option to add or remove parameters. Enabling the Show Parameter Table menu item will add a table to the bottom of the chart listing the parameter(s) plotted. Right-clicking in this chart allows for setting the properties of individual parameters, as well as adding a new parameter to the chart.
- Chart - Allows for changing the chart layout, zooming in/out of the chart, saving the chart, and accessing the Vertical Profile Properties window.
- Probe - Allows for changing many display preferences of the probe. See the View->Probe menu option on the Charts page for more information.