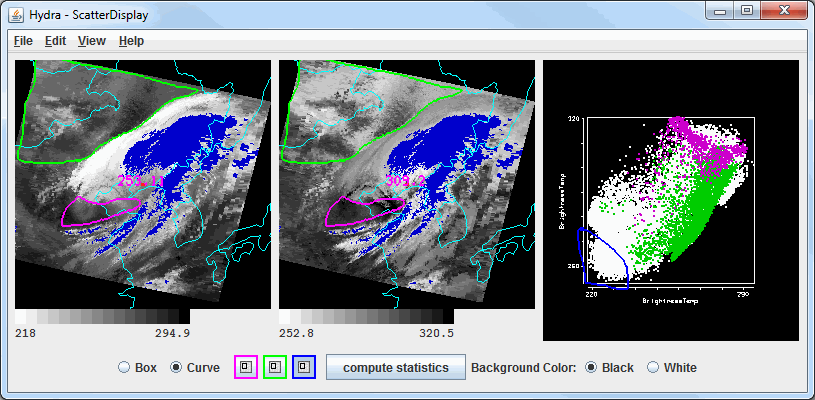
Image 1: HYDRA Scatter Analysis Display
The Scatter Analysis controls are used to create a scatter plot within McIDAS-V. The scatter controls show three different panels:
The plot on the first panel on the left represents the first field selected in the Field Selector, the panel in the middle represents the second field which is selected through the Field Selector window, and the panel on the right is the scatter analysis of the two fields. The first field selected is represented on the X-axis (abscissa) and the second field selected represents the Y-axis (ordinate). The X-axis is selected in the Field Selector - the channel selected in the lower right Channels tab will be used as the X-axis.
Regions can be subsetted in any of the three panels, and the equivalent points will also be selected in the other two panels. For example, if a box is drawn in panel 1, the same box will be drawn in panel 2, and the points in these boxes will be colored the same in panel 3, the scatter analysis. To draw a box, select a Box radio icon and a color and use Shift+left-click and drag to select a region. Any enclosed shape can be drawn by selecting the Curve radio button and a color and using left-click and drag in any panel to select a region. A user is allowed one box and one curve per color in the scatter analysis (panel 3), and one box and one curve for the images (panels 1 and 2). To remove a region that has been subsetted, double-click on the color of the region to remove next to the Box/Curve radio buttons.
 - Sets the color of the box/shape and asociated pixels in the images and scatter analysis.
 - Removes any boxes or shapes drawn in the images or scatter analysis.
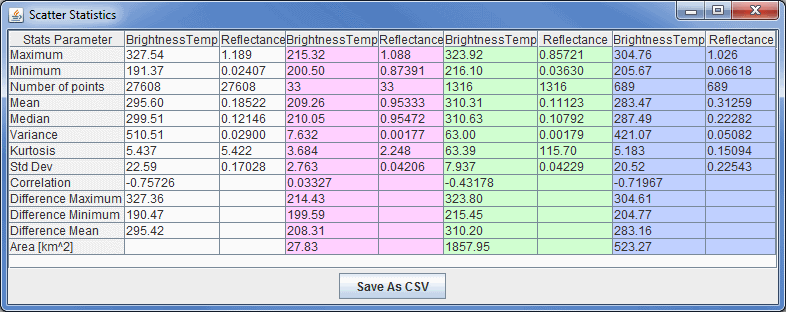
 - Opens a Scatter Statistics window which shows statistical information about the pixels contained within the user-defined domains drawn in the images or scatter analysis.
Below is the Scatter Statistics window that appears when the button is clicked. This includes statistical information about the data as a whole, as well as the regions of the data that were subsetted with a box/curve. The values in the white columns are computed for the image as a whole, and the values in the colored columns are computed for the area of the respective box/curve.
 - Saves this statistical data as a Comma-Separated Values (CSV) file (*.csv).
All of the menu items seen utilizing this display are standard options that can be found in the Menus section of the Layer Controls page.