9.3. Creating ACSPO SST Reprojections
This set of examples demonstrates how you can create high quality Sea Surface Temperature (SST) color enhanced images using a number of the functionalities available in Polar2Grid.
9.3.1. Creating ACSPO GeoTIFF files
Find the options available for creating ACSPO VIIRS SST GeoTIFFs:
polar2grid.sh -r acspo -w geotiff -h
List the products that can be created from your ACSPO NetCDF dataset:
polar2grid.sh -r acspo -w geotiff --list-products -f <path_to_acspo_file>
To create the default product image, which is sst taken from
the sea_surface_temperature array in the ACSPO file,
use the following command. The example data set is the NOAA-20 VIIRS
direct broadcast overpass from 18:43 UTC, 10 August 2022. Since there is
often cloud cover and land in your datasets, use the --grid-coverage
option to bypass the requirement for 10% coverage of data in the output
image. Also note that we are using --fill-value 0 to make a one
band output file with a black background.
polar2grid.sh -r acspo -w geotiff --grid-coverage 0 --fill-value 0 \
  -f viirs/20220810184327-CSPP-L2P_GHRSST-SSTskin-VIIRS_N20-ACSPO_V2.80-v02.0-fv01.0.nc
The data set is re-projected into the WGS84 (Platte Carrée) projection
by default. The image scaling is defined in the generic.yaml file located in the
$POLAR2GRID_HOME/etc/polar2grid/enhancements directory.
This file contains product scaling information for all data parameters supported by
Polar2Grid. It replaces the rescale.ini file that was used in some previous versions of Polar2Grid.
The default scaling used for the ACSPO Version 2.80 SST files can be found under sea_surface_temperature4 sea_surface_subskin_temperature which is taken from the ACSPO array standard_name attribute. The section of the generic.yaml file that references our SST product is listed below.
430   sea_surface_temperature4:
431     standard_name: sea_surface_subskin_temperature
432     operations:
433       - name: linear_stretch
434         method: !!python/name:satpy.enhancements.contrast.stretch
435         kwargs: {stretch: 'crude', min_stretch: 267.317, max_stretch: 309.816}
This is used in the Polar2Grid software to define the range of brightness values in the output GeoTIFF file (0-255) to the temperatures they represent - in this case 267.317 K to 309.816 K. There are a number of different sea surface temperature arrays defined in the the generic.yaml file that allow Polar2Grid to support previous versions of the ACSPO SST files.
The scaling is done linearly. The output greyscale image below shows the VIIRS I-Band 2 (.86 micron) Reflectances on the left, and the ACSPO SST VIIRS image on the right.
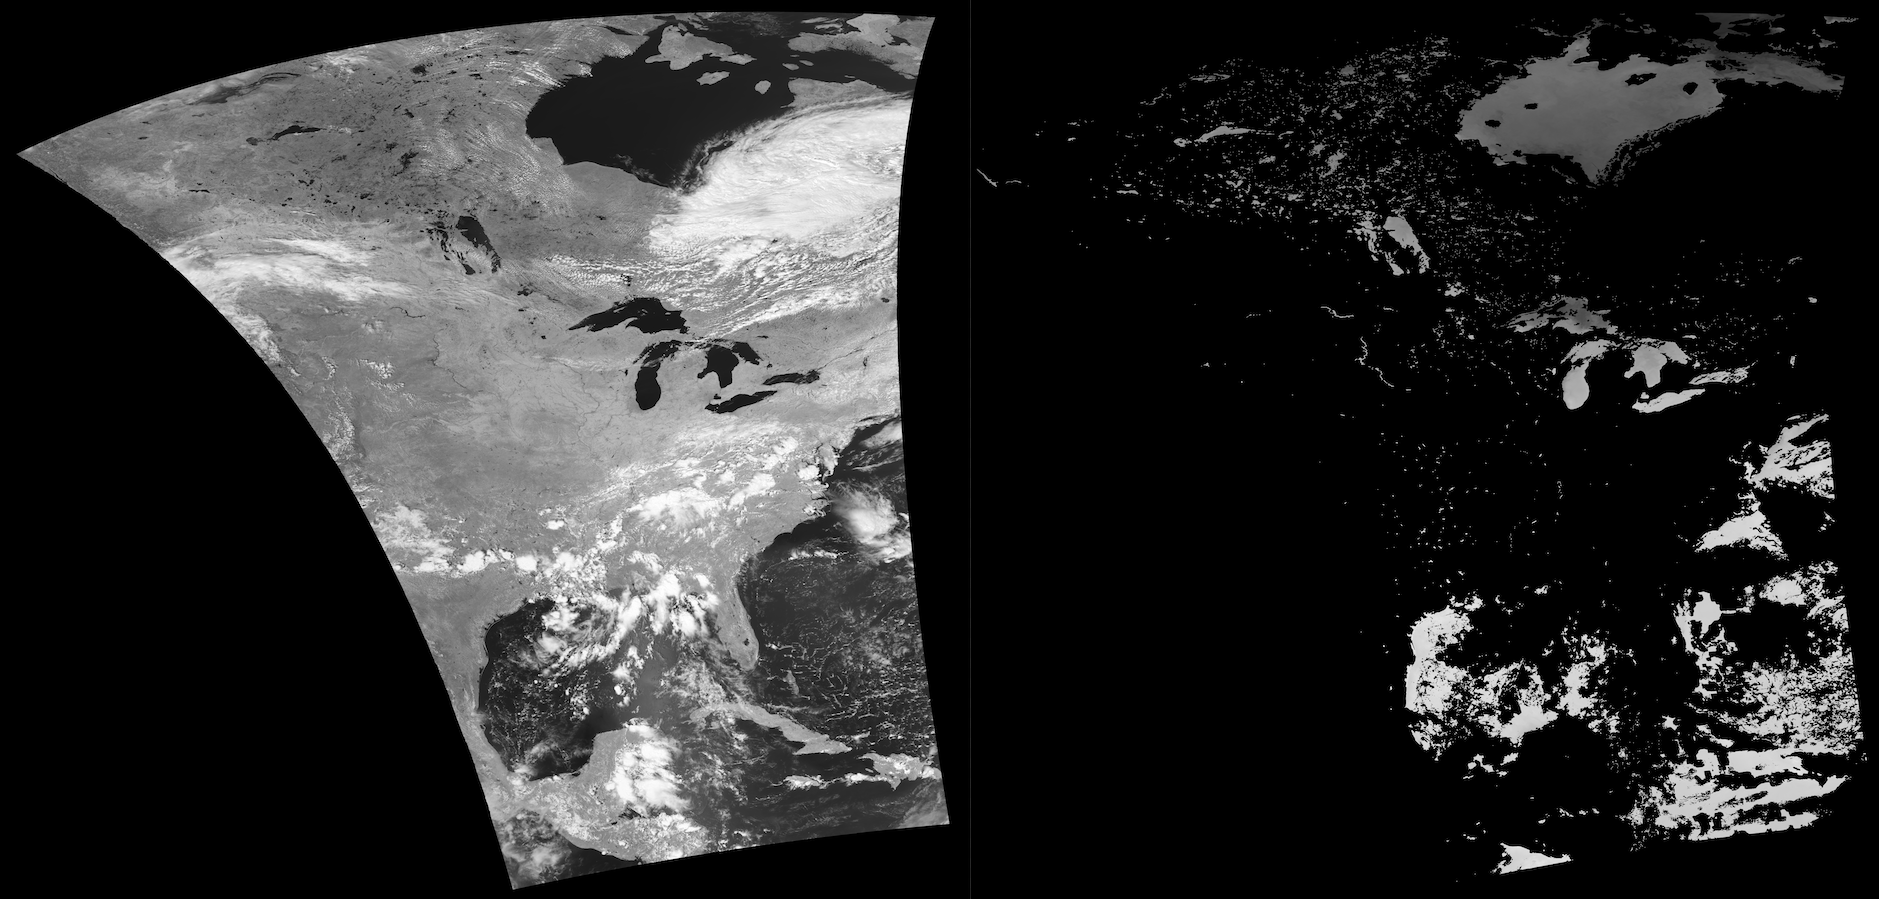
Fig. 9.6 NOAA-20 VIIRS I-Band 02 Reflectance image (Left panel) and ACSPO Sea Surface Temperature image (Right Panel) from an entire direct broadcast pass acquired on 10 August 2022 over North America. The default projection is WGS84 (Platte Carrée) and the default scaling is greyscale brightness values 0-255.
Now I would like to create an image cutting out a subset of this pass over the Great Lakes in the Northern United States. To do this, I need to create a new grid. I will use the Defining Your Own Grids (Grid Configuration Helper) script to do this.
p2g_grid_helper.sh great_lakes -83.5 45.1 750 750 1800 1200
I named my grid great_lakes, centered it on -83.5 E Longitude and 45.1 N Latitude, with 750 m spatial resolution in the X and Y directions, and defined the output grid to be 1800 x 1200 elements and lines.
Executing this command results in the following grid definition:
great_lakes:
  projection:
    proj: lcc
    lat_1: 45.1
    lat_0: 45.1
    lon_0: -83.5
    datum: WGS84
    units: m
    no_defs: null
    type: crs
  shape:
    height: 1200
    width: 1800
  center:
    x: -83.5
    y: 45.1
    units: degrees
  resolution:
    dx: 750.0
    dy: 750.0
I store this grid in an ASCII text file named my_grid.yaml, which I can provide to polar2grid.sh to create an image over my subset region by executing this command:
polar2grid.sh -r acspo -w geotiff --grid-coverage 0 --grid-configs my_grid.yaml \
  -g great_lakes --fill-value 0 -f viirs/*.nc
Note that you need to provide the full path to the my_grid.yaml if it is not located in the execution directory. The subset image that is created from executing this command is shown below.
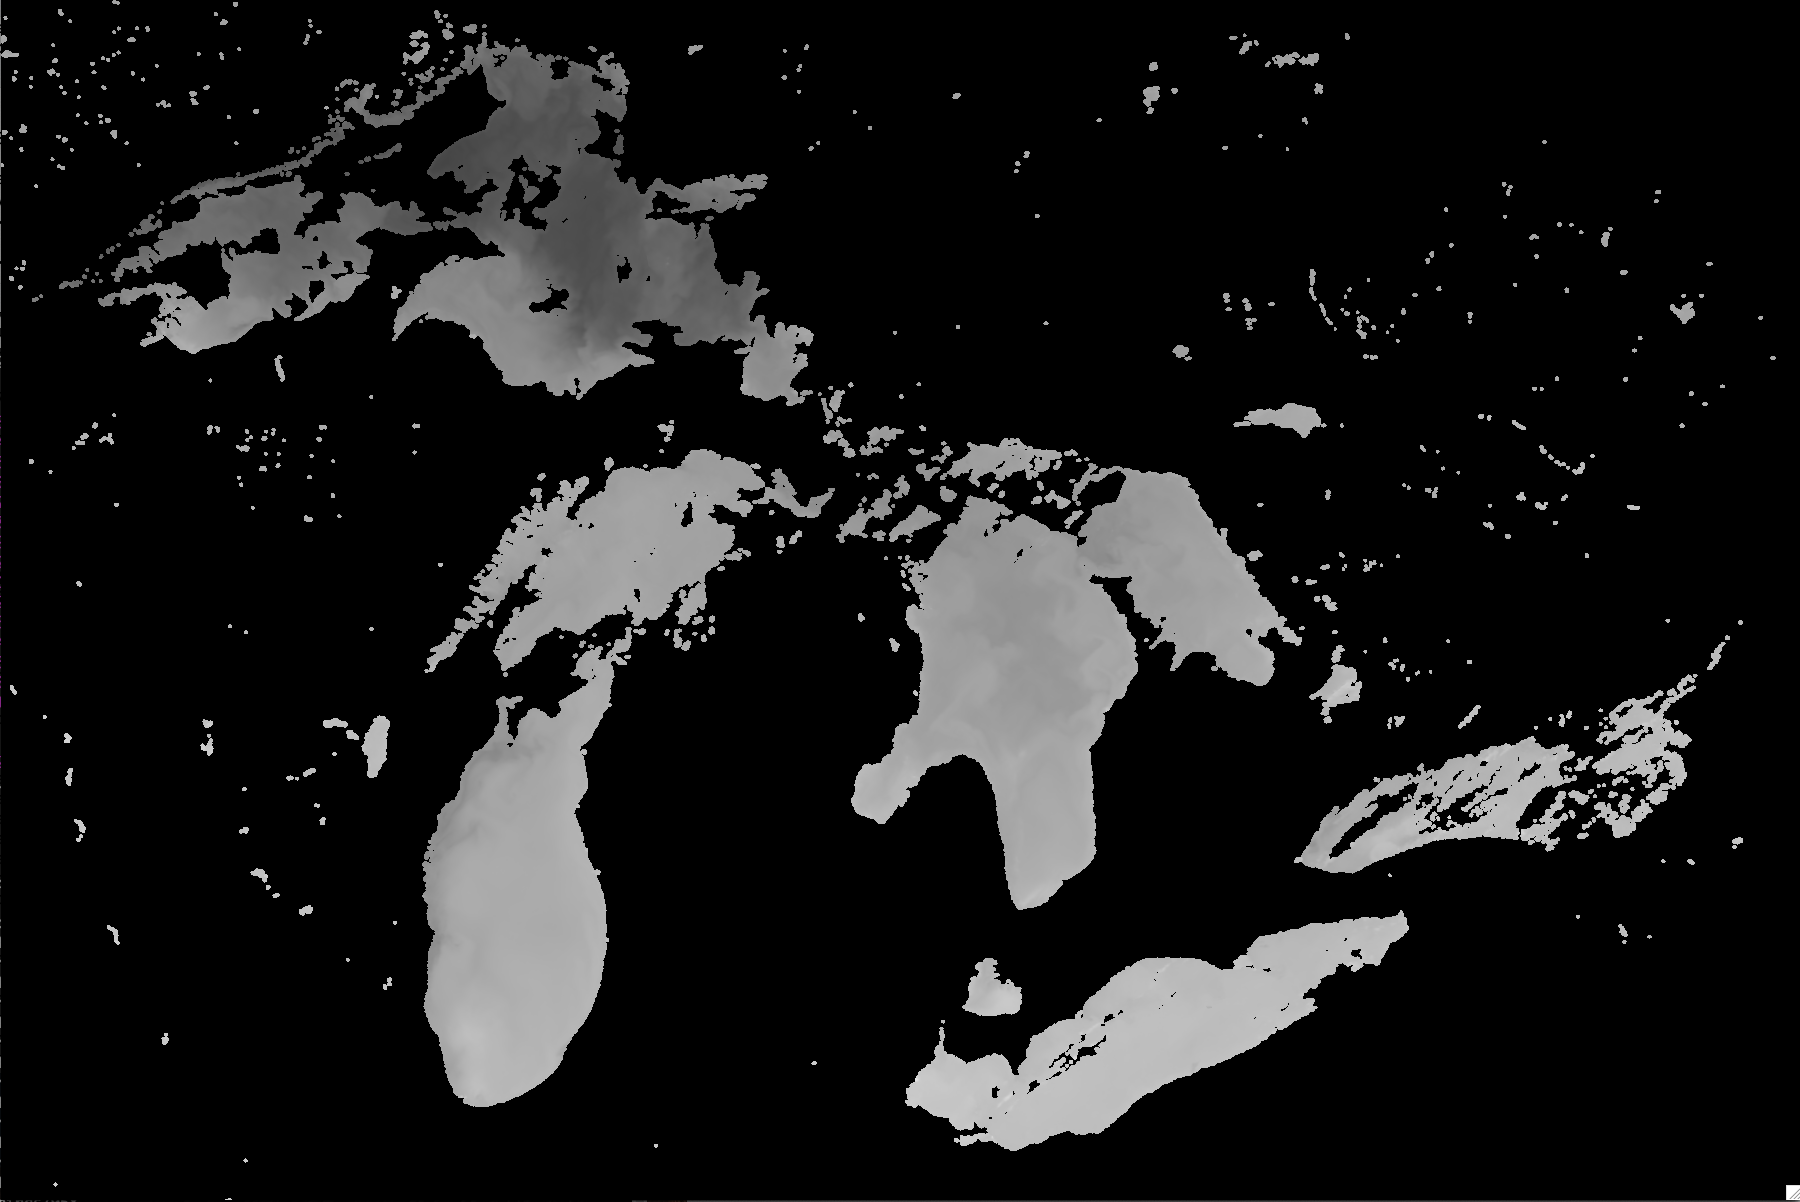
Fig. 9.7 NOAA-20 VIIRS ACSPO SST subset image for our defined grid over the great lakes.
To add a color enhancement to this image, I use the add_colormap.sh utility script and a rainbow color table p2g_sst_palette.txt that is included as part of the Polar2Grid package. This table is formatted as described in the Add Colormap section. You can view the file online.
This colormap will assign a color value to each of the 0-255 brightness range in the GeoTIFF image. Again, the default brightness range is associated with a temperature range of 267.317 K to 309.816 K.
add_colormap.sh $POLAR2GRID_HOME/colormaps/p2g_sst_palette.txt noaa20_viirs_sst_20220810_184327_great_lakes.tif
The filename will not change, but a color enhancement will be added to the image as shown below.
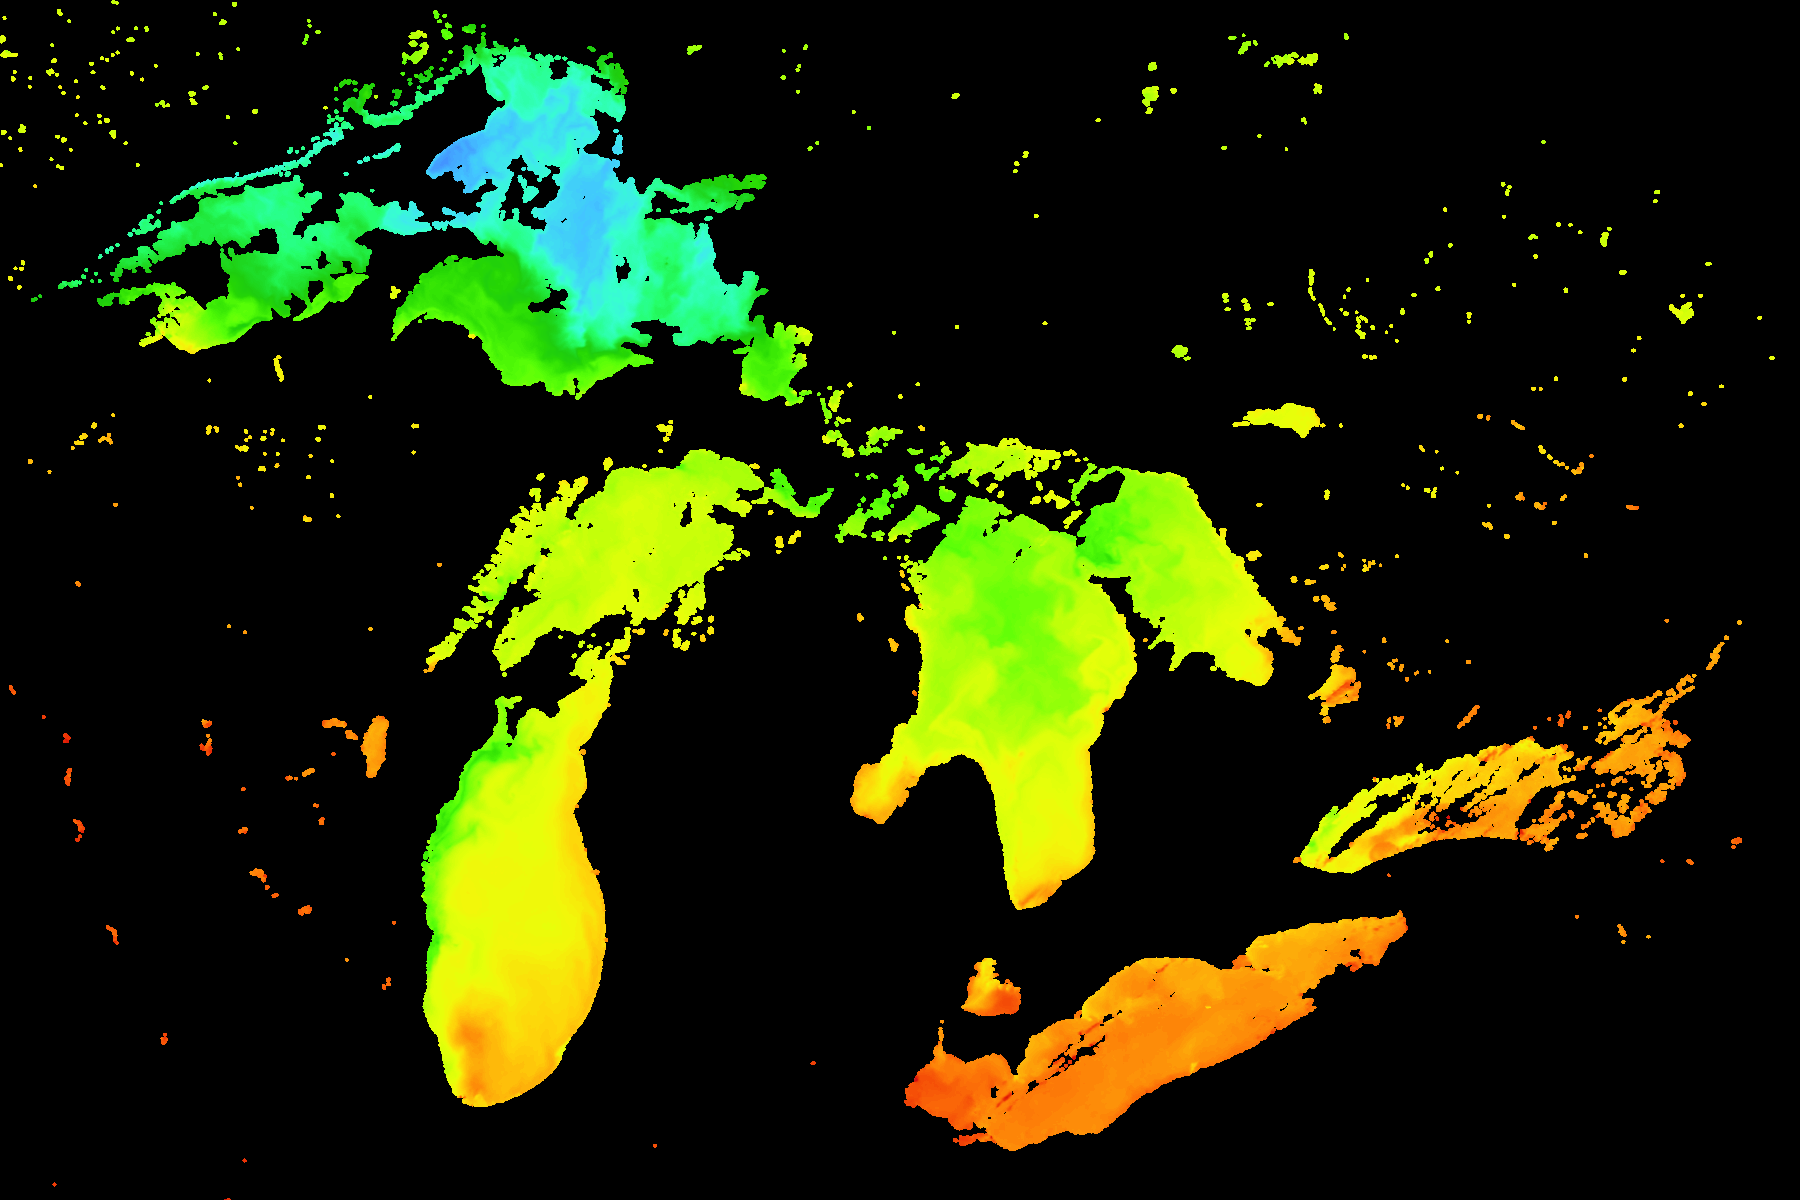
Fig. 9.8 NOAA-20 VIIRS ACSPO SST color enhanced image for our defined grid over the great lakes.
We can tighten the temperature range that is displayed in our region of interest by creating our own local rescaling. This allows us to use the full range of brightness values. In order to do this, I need to create a new rescaling yaml file that I will then provide to polar2grid.sh.
I chose an enhancment name of great_lakes_sst and will use the same standard_name of sea_surface_subskin_temperature and then redefine the relationship between the brightness values and the data. I tighten the temperature range to be between 275.0 K and 305.0 K. The contents of my new rescale yaml file is shown below (my_rescale.yaml).
enhancements:
  great_lakes_sst:
    standard_name: sea_surface_subskin_temperature
    operations:
      - name: linear_stretch
        method: !!python/name:satpy.enhancements.contrast.stretch
        kwargs: {stretch: 'crude', min_stretch: 275.0, max_stretch: 305.0}
I can then apply this new rescaling by referencing the file in the polar2grid.sh execution. In the example below, my_rescale.yaml file is located in the execution directory. If it is not, you will need to provide the full path to the file. The original noaa20_viirs_sst_20220810_184327_great_lakes.tif file will be overwritten by using this command.
polar2grid.sh -r acspo -w geotiff --extra-config-path my_rescale.yaml \
  --grid-coverage 0 --grid-configs my_grid.yaml -g great_lakes \
  --fill-value 0 -f  viirs/*.nc
The result of applying this rescaling to my image and applying my colormap is shown below.
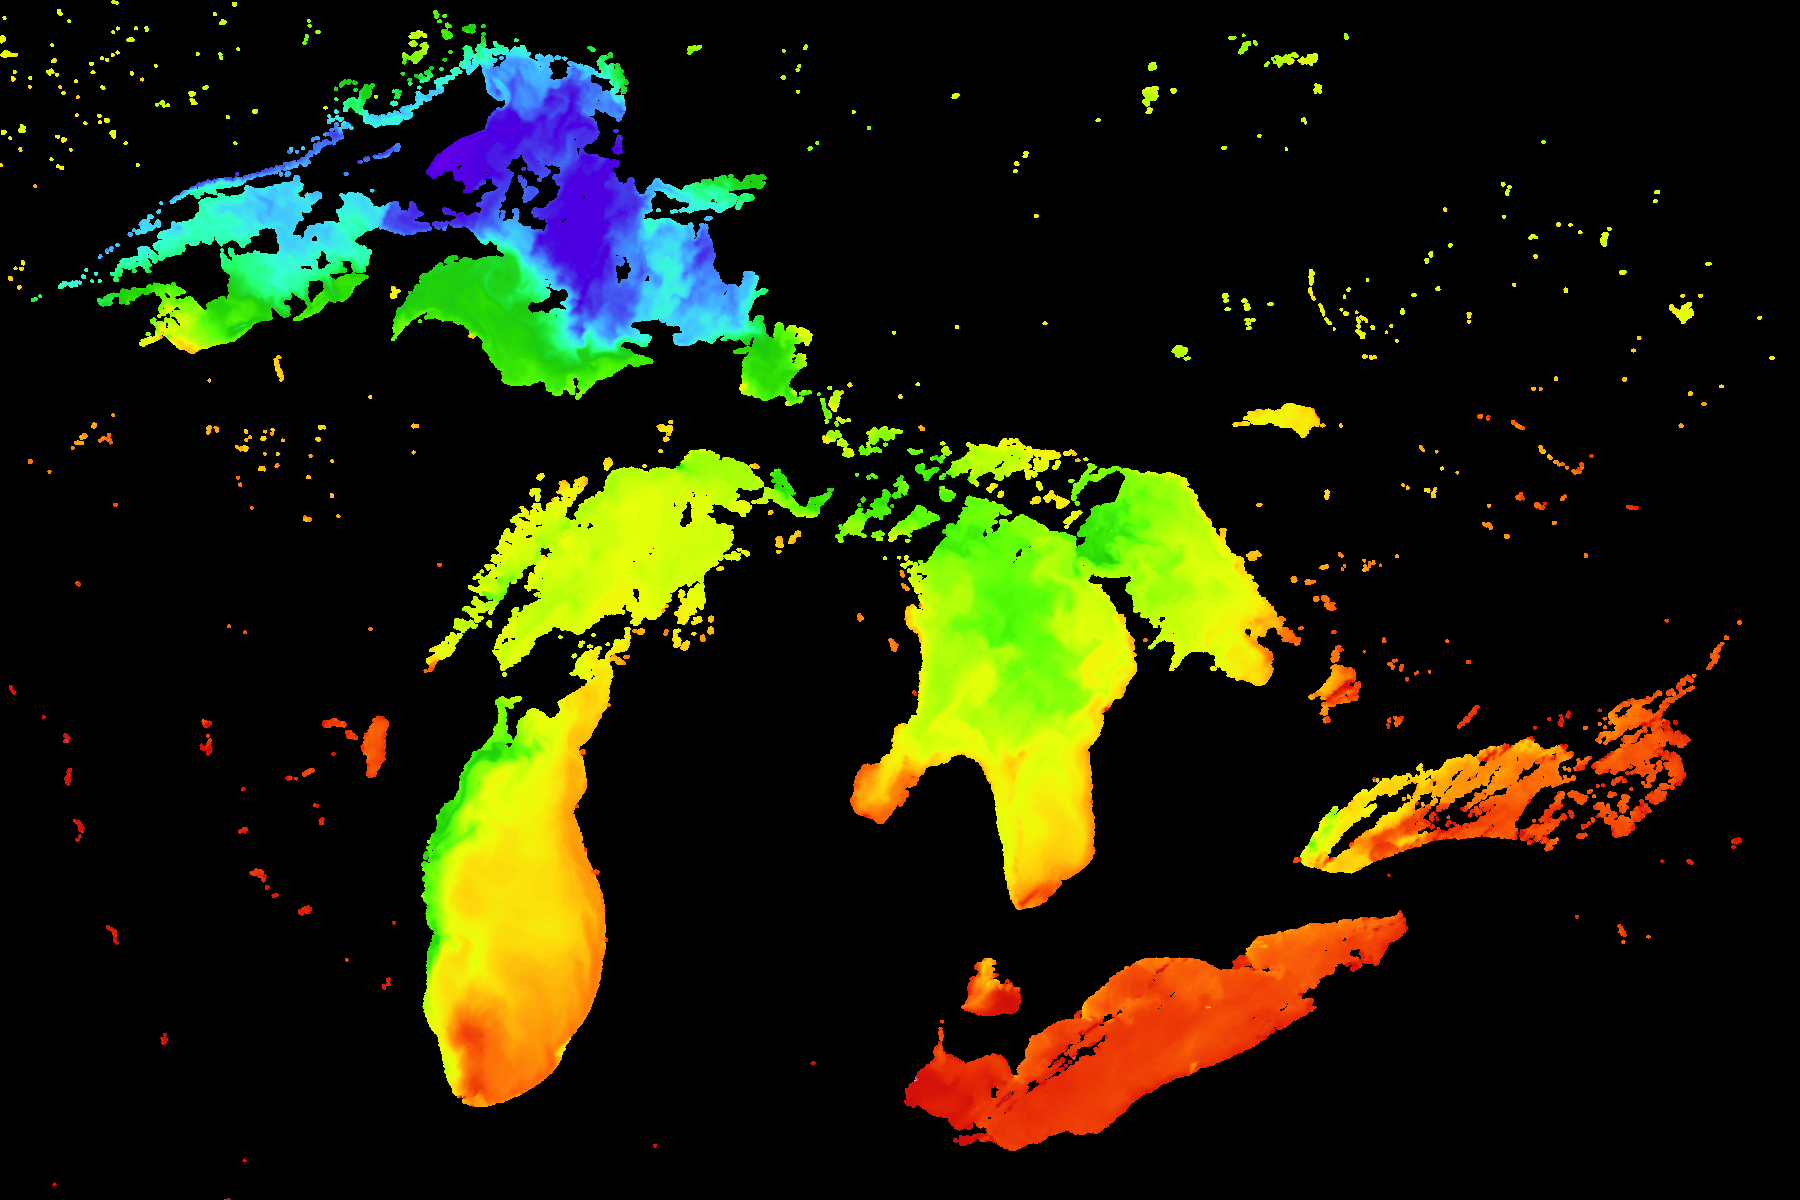
Fig. 9.9 NOAA-20 VIIRS ACSPO SST color enhanced subset image over our area of interest using a customized rescaling that linearly maps brightness values of 0-255 to a temperature range of 275.0 K to 305.0 K.
To further enhance this ACSPO SST image I can add a color bar using the add_coastlines.sh script. There are many options to this script all of which are listed in the Add Overlays (Borders, Coastlines, Grids Lines, Rivers) section. Users can control the location and size of the color bar, a color bar title, fonts, etc. The script overlays the color bar and text onto the image storing it as a .png file.
For example, executing the following command:
add_coastlines.sh noaa20_viirs_sst_20220810_184327_great_lakes.tif \
  --add-colorbar --colorbar-text-color "white" \
  --colorbar-units "°K" --colorbar-align bottom --colorbar-text-size=20 \
  --colorbar-title "VIIRS ACSPO SST 10 August 2022 18:43 UTC" \
  --colorbar-height 35 --colorbar-tick-marks 4
results in the creation of the file noaa20_viirs_sst_20220810_184327_great_lakes.png as displayed below.
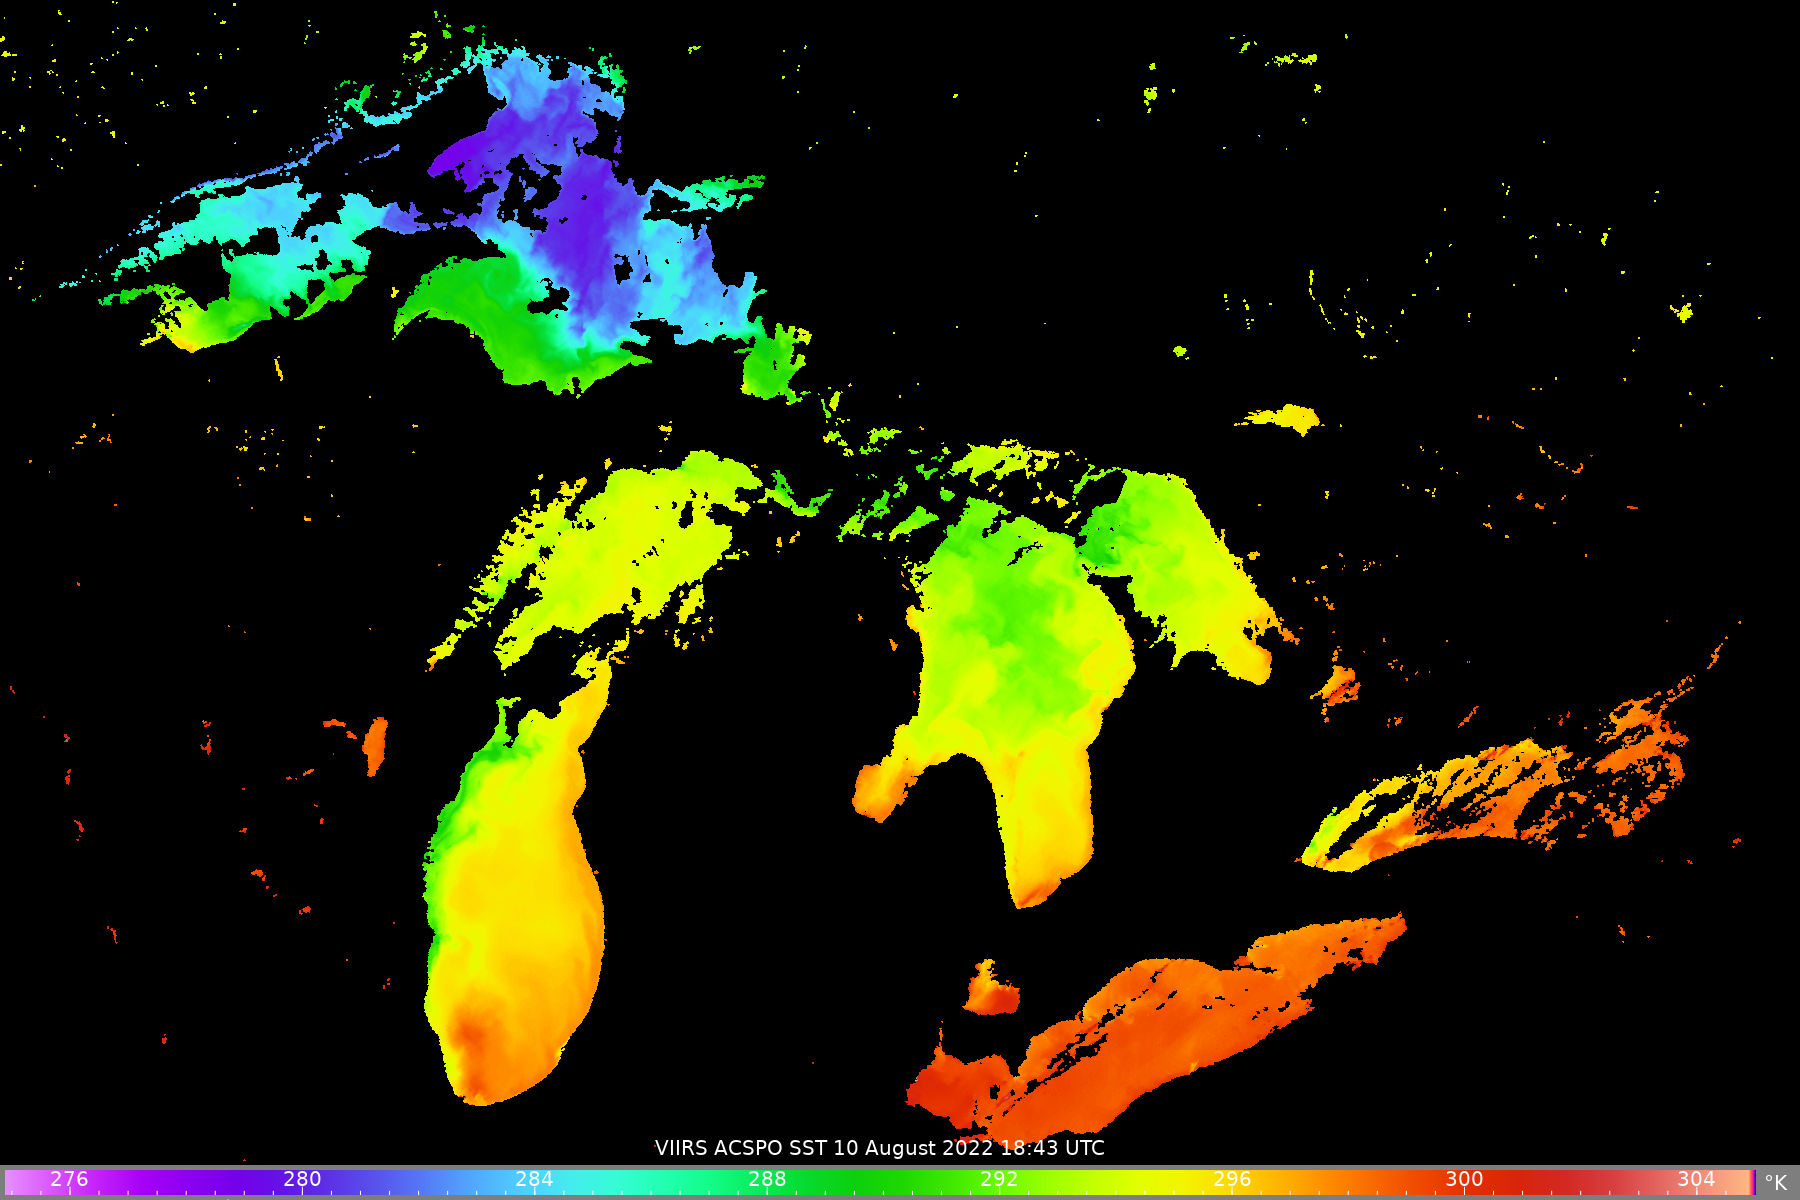
Fig. 9.10 NOAA-20 VIIRS ACSPO SST color enhanced subset image over the great lakes using a customized rescaling that linearly maps brightness values of 0-255 to a temperature range of 275.0 K to 305.0 K including a overlaid color table.
If you wanted to create a display using a more familiar SST temperature scale such as Celsius
or Fahrenheit, you can do that by using the --colorbar-min and
--colorbar-max options to add_coastlines.sh. This will not change
any data values in the file, but it will change the color table display.
For example, I have set the dataset range in my file to be 275.0 K to
305.0 K. This is equivalent to a range in Degrees Celsius of 1.85 C to 31.85 C.
So by executing the following command, I can display the image
with a color bar in Degrees Celsius.
add_coastlines.sh noaa20_viirs_sst_20220810_184327_great_lakes.tif \
  --add-colorbar --colorbar-text-color "white" \
  --colorbar-units "°C" --colorbar-align bottom --colorbar-min 1.85 \
  --colorbar-max 31.85 --colorbar-tick-marks 5 --colorbar-text-size=20 \
  --colorbar-title "VIIRS ACSPO SST 10 August 2022 18:43 UTC" \
  --colorbar-height 35
I can perform a similar conversion of the temperature range to Degrees Fahrenheit and create an image with a color bar labeled in those units.
add_coastlines.sh noaa20_viirs_sst_20220810_184327_great_lakes.tif \
  --add-colorbar --colorbar-text-color "white" \
  --colorbar-units "°F" --colorbar-align bottom --colorbar-min 35.33 \
  --colorbar-max 89.33 --colorbar-tick-marks 5 --colorbar-text-size=20 \
  --colorbar-title "VIIRS ACSPO SST 10 August 2022 18:43 UTC" \
  --colorbar-height 35
I can also use the same add_coastlines.sh command to overlay maps including borders and latitiude longitude grids. For example, if I execute the command,
add_coastlines.sh noaa20_viirs_sst_20220810_184327_great_lakes.tif \
  --add-borders --borders-level 3 --borders-outline gray --borders-width 2 \
  --borders-resolution h --add-colorbar --colorbar-text-color "white" \
  --colorbar-units "°C" --colorbar-align bottom --colorbar-min 1.85 \
  --colorbar-max 31.85 --colorbar-tick-marks 5 --colorbar-text-size=20 \
  --colorbar-title "VIIRS ACSPO SST 10 August 2022 18:43 UTC" \
  --colorbar-height 35
it will result in the creation of the final image product that is a re-gridded, re-scaled, color enhanced image with a color bar labeled in Degrees Celsius with border overlays.
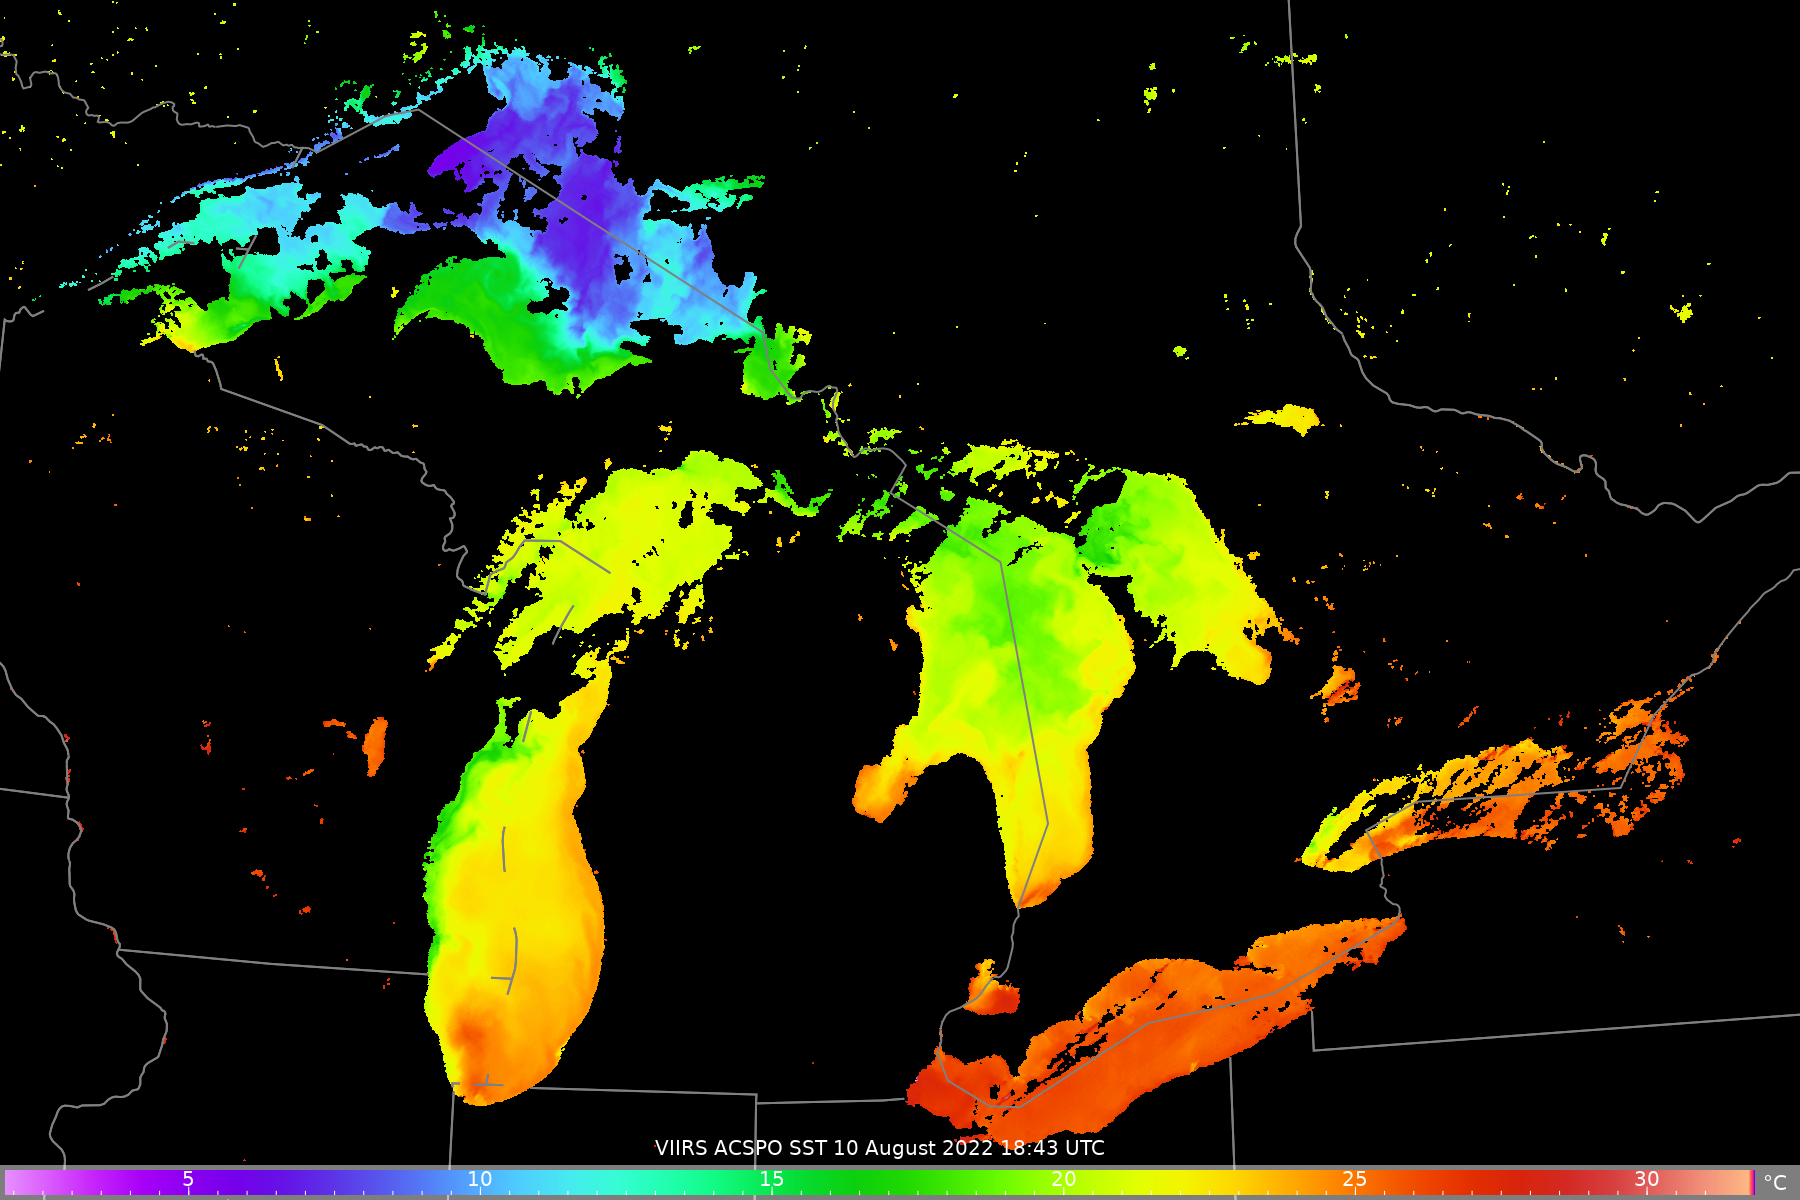
Fig. 9.11 Final NOAA-20 VIIRS ACSPO SST image created from data acquired by direct broadcast on 10 August 2022 beginning at 18: UTC. The image creation includes re-gridding, re-scaling, applying a color enhancement using a color table and map overlays.