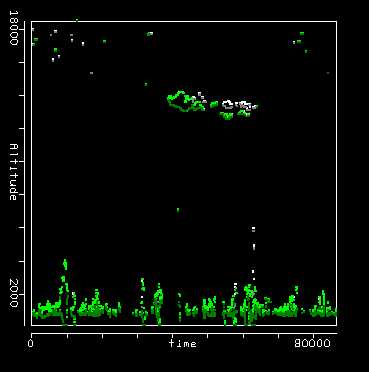
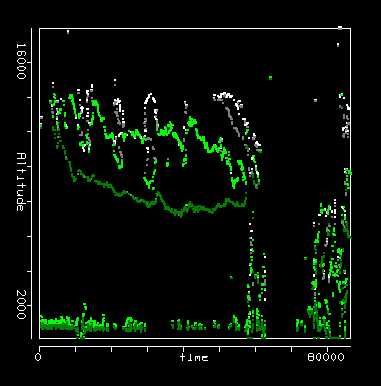
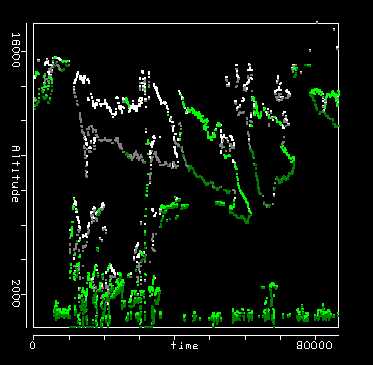
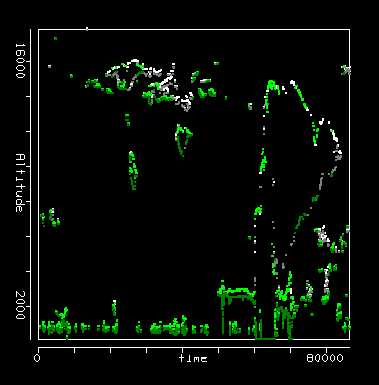
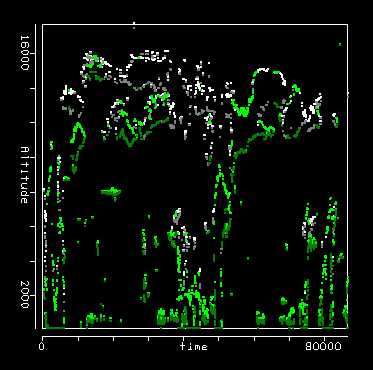
These are based on one year (Nov '98 through Oct '99) of cloud boundary data from Nauru. The data are binned in 250m (height) x 900 sec (time). A 30 day sample image (30 June to 29 July 1999) can be compared with full 10 second data for June 30, July 7, July 10, July 19, July 20. Note: time runs down and height increases to the right in the 30 day image. The plots below are in no particular order.
Distribution of ice cloud tops for single layer and for all ice cloud layers (only highest cloud top reported)
Cumulative frequency of ice cloud thickness that are single layer as determined by 75% and 50% cloud fraction.
Cumulative frequency of ice cloud thickness for all ice clouds as determined by 75% and 50% cloud fraction
Frequency of ice cloud thickness for single layer ice clouds as determined by 75% and 50% cloud fraction
Frequency of ice cloud thickness for all ice clouds as determined by 75% and 50% cloud fraction
Cumulative frequency of cloud thickness for all clouds
Cloud thickness distribution for all clouds.
Cumulative frequency of number of layers for only ice clouds.
Cumulative frequency of number of layers for all clouds.
Last Updated on 9/3/00
By Dave Santek