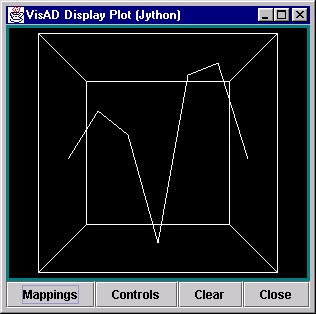
y = field( (1,5,3,-6,8,9,1) )
plot(y)
You will see this plot:
That means you have a function like:
y = f(x)where you've defined samples at 7 points. With no other information, the VisAD field() function assumes that the values of x are linearly spaced. VisAD has a very convenient notation for representing this type of function:
(x -> y)This can be thought of as defining a domain called x which maps to a range named y. These functional definitions can, of course, become more complex. Let's suppose we have an image, with data points defined at a set of scan lines and pixels. One might use this notation to define this:
((Pixel,Line)->value)
If we had a time-series of these, the Function Type notation would be simply:
(Time-> ( (Pixel,Line)->value)))There is a helper function, dumpTypes() that you may use to explore the VisAD data structure a little more. (You can find more information about this in the section on Using Data Type functions.) If, after plotting the data with the two Jython commands above, you did this command:
dumpTypes(y)the Jython interpreter will display:
VisAD MathType analysis
  FunctionType:
  Domain has 1 components:
   0. RealType: domain
   0.   Name = domain
  Range:
    RealType: value
      Name = value
- - - - - - - - - - - - - - - - - - - - - - -
DataType analysis...
    FlatField of length = 7
    (domain -> value)
      Domain has 1 components:
        Integer1DSet (domain) Range = 0 to 6
      Range has 1 components:
        0. FloatSet (value) Dimension = 1
        0. number missing = 0
There are two sections to this listing. The top portion describes the
so-called MathType of the elements of this VisAD Data object
(this is analogous to the "type" of any data - like "int", "float",
etc. - but VisAD data types may contain extra metadata, like units and
error estimates).
The bottom part presents an analysis of the data itself; the
hierarchies must, of course, be the same in both sections, but the
lower one talks about the data values and their structure.
So, in this case, where we did not overtly define any of the types or units, etc., for the values, only that we were giving a one-dimensional set of samples, the field() function supplied the "types" and the values for the independent variable. If you're curious about these things, there is much more information available at the VisAD web site (give link).
In the tutorial section on Using Data Type functions there are more examples of discovering data types and extracting information from VisAD data objects.
image1 = load("AREA0001")
image2 = load("AREA0002")
imagediff = image2 - image1
plot(imagediff)
to illustrate how easy it is to perform arithmetic between objects.
You will find in subsequent sections, that we didn't stop here. If
you need a Fast Fourier Transform, you simply do:
fftimage = fft(image1)and you've defined an FFT of the image object.
Further, if you want to do something like compute the average value in the image, the following Jython code would do it:
sum = 0
for i in range(image1.length):
  sum = sum + image1[i]
print "Average is",(sum/image1.length)
In this case, the Jython notation image1[i] refers to the i-th sample in the VisAD Data object "image1". (As a note, the Jython range() built-in function is extremely powerful...)
As easy as this is, here's a slight more complicated example. Let's suppose we have an image and a "basemap" - a geo-political map outline defined by (Longitude,Latitude) points, as will be the case when map files are read by the VisAD ShapeFile or BaseMap File Adapters. We want to print out the image values at every point given in the map file. Here's the Jython code to do this:
image = load("AREA0001")
basemap = load("OUTLUSAM")
for p in range(basemap.length):
  print "image = ",image[basemap[p]]," at ",basemap[p]
That's it!! No kidding!
What's happening is that each point in the basemap has
a "value" of (Longitude,Latitude). When you use the notation
basemap[i], the result is one (Longitude,Latitude) pair.
Now, when you say image[basemap[i]], you are really asking
for the sample from the image at the given
(Longitude,Latitude). As we saw above, if we had just said
image[i] we would have gotten the i-th sample; however, in this
case, we've implicitly asked for the sample at the specified
(Longitude,Latitude).
Be sure to look over the section on Using Data Types for more depth and examples related to this.