Using JPythonMethod's data rearrange and extract functions
May, 2001
updated Sept. 2002
Introduction
Complex Data objects are easily represented in VisAD; however, to use
them in your application, you may want to rearrange them. The
following methods are available to help with this:
- extract(Field d, component) - returns a Field which is the 'component' range component of data
- extract(Field d, Type t) - returns a Field in which the MathType
t has been extracted.
- resample(Field d, domain) - returns a new field, resampled from 'd' into the new 'domain'. The domain type must be identical to the original.
- combine(Field [] d) - returns a single new Field with the same domain as all the
original 'd' fields, and a range that is the combined range of all the 'd' fields.
- getValues(Field d) - returns a double[][] of the 'flat' components of Field 'd' in their default units. The first dimension of the returned array is the number of range compnenents.
Functions to make a domain sampling set
If you plan on resampling your data, you will need to define the
domain -- either by using the domain of an existing Data object, or
creating a new one. Several helper functions are available:
- getDomain(Data d) - returns the domain sampling set of the data
- makeDomain(min, max, int npts) - returns a 1-D domain of from min to max. 'min' and 'max' may be either ints or floats or doubles.
- makeDomain(Type t, min, max, int npts) - same as previous, except
you define the MathType of the domain components
- makeDomain(min1, max1, len1, min2, max2, len2) - same as above
except for 2-D topology.
- makeDomain(Type t, min1, max1, len1, min2, max2, len2)
- makeDomain(min1, max1, len1, min2, max2, len2, min3, max3, len3) - same as above except for 3-D topology.
- makeDomain(Type t, min1, max1, len1, min2, max2, len2, min3, max3, len3)
Some examples
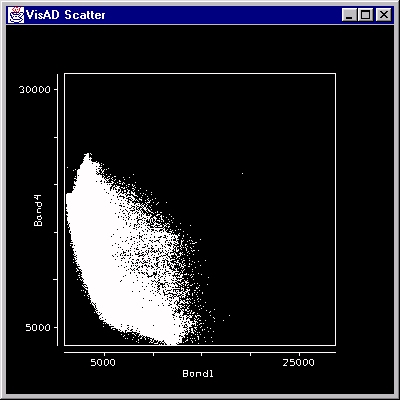
Suppose you have a multi-channel image and just want to draw a quick
scatter plot of the brightness values in channel 0 versus channel 2.
a=load("../data/mcidas/AREA0008")
graph.scatter( extract(a,0), extract(a,2))
This will show you:
Back to the home page