Here are the signatures for the hist() funciton:
Return a Data object that contains counts for the indicated range components in 20 equally-spaced bins. You may specify more than on range component, in order to get a multi-dimensional histogram.
Return a Data object where you specify the ranges and the bin sizes for each.
Return a Data object where the dimension and bin sampling are defined by the set
a = load("../data/mcidas/AREA0008")
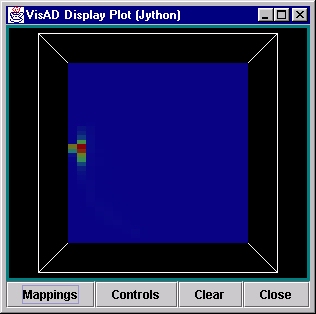
h = hist(a, [0,2], [20,40])
plot(h)
Produces this display:

which maps the count of brightness values of channel 0 into 20 equally-spaced bins, the count of brightness for channel 2 into 40 bins.