Severe weather 2018
As spring 2018 approaches so does the likelihood of severe weather. Each year, cities around the US brace for flooding and damage that often accompany hazardous storms. And each year, researchers are predicting the timing and severity of these events with greater precision.
The University of Wisconsin-Madison Cooperative Institute for Meteorological Satellite Studies (CIMSS), along with partners at the National Oceanic and Atmospheric Administration (NOAA) are part of this predictive success. Together, they are improving severe weather forecasts by inventing techniques to better track and forecast when and where storms will hit.
CIMSS scientists Jordan Gerth, Anthony Wimmers, Chris Velden, and NOAA Advanced Satellite Products Branch scientist Mike Pavolonis are leading investigations to put satellite and other data to use for analyzing severe local storms, hurricanes, and other high-impact weather hazards such as upper-air turbulence that is dangerous to aircraft.
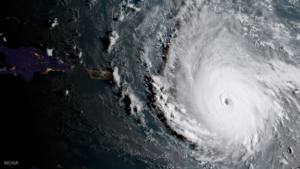
GOES-16 imagery of Hurricane Irma as it passes over the Caribbean. Credit: NOAA
Added to their arsenal are data from the latest satellites, including NOAA’s Geostationary Operational Environmental Satellite GOES-16, polar orbiting NOAA-20, and soon GOES-17. All are equipped with instruments that are enabling better algorithms, visualizations, and data analysis. In fact, GOES-16 data has already provided scientists with new insights into these atmospheric systems.
Scientists and engineers worked for a decade to design an imager with three times the spectral imaging bands, four times greater spatial resolution, that could scan at a rate five times faster than previous GOES. The first light images and videos crafted from GOES-16 data captured the world’s attention. But going further, what have researchers been able to learn from the huge amounts of data being sent back every day?
According to CIMSS and NOAA researchers, last year’s active severe weather and hurricane seasons gave GOES-16 a lot to look at. It spent most of 2017 in a non-operational test phase, actively observing the weather and sending back near real-time data but it was not used by meteorologists to make official forecasts until they were certain the data were consistent and reliable. In December 2017 GOES-16 became operational and moved to its final observation point at 75ºW longitude, replacing the previous GOES-13 satellite.
The NOAA-20 satellite was launched in November 2017 and is the first in the series of NOAA’s latest generation of polar-orbiting satellites called the Joint Polar Satellite System. Circling the Earth from pole-to-pole, it provides full global coverage twice a day, giving meteorologists unprecedented information on atmospheric temperature, moisture, clouds, and a variety of other variables. NOAA-20 is providing imagery and products on a provisional basis and will become fully operational later this year.
Armed with these new advanced observing platforms, the CIMSS research teams plan to continue interrogating the data to improve severe weather products and prediction capabilities.
Predicting severe local weather with ‘ProbSevere’
Started in 2006 at CIMSS, the ProbSevere program is a unique statistical model used to predict the likelihood of severe weather using near real-time GOES data. Program director Mike Pavolonis and his team have worked to integrate the system into some National Weather Service (NWS) offices in an experimental mode so that it could be tested and refined. But by early 2019, the ProbSevere system will be used operationally, 24/7, at one of the NWS offices.
“It’s an exciting time as we continue to work to transition this once experimental product to a fully-supported system we can use for advanced storm warnings,” says Pavolonis.
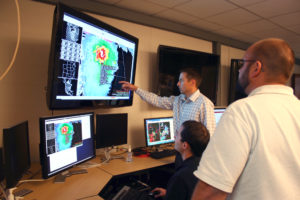
Program Director Mike Pavolonis (center) and his team continue to update the ProbSevere system to use near real-time GOES data. Credit: SSEC
He and his team spent much of 2017 integrating the GOES-16 data into the ProbSevere system, which blends radar, satellite, ground-based lightning data and numerical weather predictions to calculate the likelihood of storms developing into severe situations. Pavolonis and his team have found that the GOES-16 satellite, with more channels, better spatial and temporal resolution, adds minutes of lead-time to storm warnings and allows for improved forecasting of specific severe weather events such as hail, tornadoes and high winds. For instance, the GOES-16 spatial and temporal resolution helps researchers resolve the storm’s core in better detail, identifying updrafts that can signal future impacts of a storm. According to Pavolonis, additional critical information, needed to improve severe weather forecasting, will be extracted from the GOES-16 measurements and integrated into ProbSevere.
Currently, the ProbSevere system is designed primarily for use over the continental US, but the team plans to expand the program to track severe weather over the oceans.
Air turbulence and hazards
An unseen part of the global weather monitoring network, the daily tracking of air turbulence, is crucial to the aviation industry that relies on up-to-date reports to avoid these troublesome areas. Every year, wind turbulence accounts for injuries to passengers and some forced early landings of aircraft that have accidentally flown into these rough patches of the atmosphere. It remains a crucial challenge to find better methods for detecting these areas so pilots can avoid them.
CIMSS researchers are investigating ways of improving observation of gravity waves, an atmospheric phenomenon that can lead to what is known as clear-air turbulence (CAT). The results of their study were recently published in Weather and Forecasting, a journal of the American Meteorological Society. Currently, it can be difficult for numerical weather prediction models to identify these subtle atmospheric signatures. But by analyzing data from the Japanese Himawari satellite and its Advanced Himawari Imager, which is nearly identical to the GOES-16 Advanced Baseline Imager, the team was able to use its high-resolution channels to readily identify areas of potential turbulence.
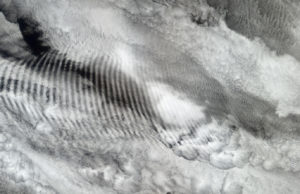
CIMSS researchers are investigating ways of improving observation of gravity waves, an atmospheric phenomena that can lead to what is known as clear-air turbulence. Credit: NASA Earth Observatory
“Within this picture of turbulence and its causes, we have begun to find types of gravity waves with consistent characteristics in the [Advanced Himawari Imager/Advanced Baseline Imager] water vapor channels that correspond to aircraft reports of turbulence,” writes CIMSS scientist Anthony Wimmers.
The team was able to identify these gravity waves using the Himawari’s 6.2 micrometer “water vapor” band and using a specific high-pass filter technique.
Co-author Jordan Gerth says the team noticed improvements from the previous GOES satellite instrumentation, which were generally too coarse to detect this scale of activity.
“It’s yet another encouraging development from the advances made on the GOES-16 system,” he says.
Hurricane tracking and analysis
Although the Atlantic hurricane season does not begin until early June, CIMSS researcher Chris Velden, who leads the CIMSS Tropical Cyclones Group, has been processing data from last year’s very active season.
“We’re using the provisional data from GOES-16 during last year’s major hurricane events to test and advance our intensity estimation algorithms, and to explore new ways to deduce hurricane behavior,” says Velden.
And the impact of last year’s hurricane activity cannot be overstated. Notably for the US, Hurricane Harvey dumped unprecedented rains over Houston, Texas and surrounding areas. More than 33 trillion gallons of water, equivalent to roughly three cubic miles of water fell across the area, causing damage estimated around $125 billion. Other major hurricanes included Irma, which prior to making landfall over the western Florida coast, ranked as one of the strongest Atlantic hurricanes since Wilma in 2005. Not long after, Hurricane Maria caused widespread damage and power outages over Puerto Rico and other Caribbean islands.
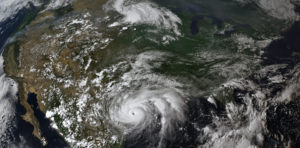
GOES-16 imagery of Hurricane Harvey, which dropped unprecedented rains over Houston, Texas and surrounding areas August 2017. Credit: SSEC/CIMSS
Despite the devastation caused by these major hurricanes, Velden says the events provided the CIMSS Tropical Cyclone research group with wide-ranging and valuable case study examples that are being used to improve their hurricane algorithms and derived products. For example, the high definition GOES-16 imagery can yield improved atmospheric motion vectors to deduce the hurricane flow fields. These types of products can be used qualitatively, but also for data feeds into numerical models to improve the track and intensity predictions. Such experiments are currently underway with national numerical modeling centers.
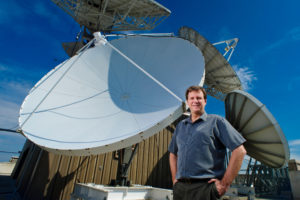
Chris Velden heads the CIMSS Tropical Cyclone research group and uses satellite data to improve hurricane tracking and understand how they form. Credit: Bryce Richter
Velden sees opportunities to combine the satellite data with other hurricane observing methods like aircraft reconnaissance and drone flights over the storms to build a more comprehensive picture of what is happening both inside and outside the storm’s core region. All of this research is aimed at improving our understanding of hurricane behavior, but another important goal is to better inform emergency managers responsible for planning and implementing coastal evacuations, for example.
Researchers at CIMSS and NOAA, committed to developing the tools necessary to anticipate severe weather events for public safety, are seeing more possibilities with the satellite data available from satellites like GOES-16, NOAA-20, and GOES-17. Looking ahead, they will continue to integrate these data to construct a more comprehensive and robust understanding of the atmosphere and its potential for severe weather.
By Eric Verbeten
Cover image credits: Cathy Finley, NASA Earth Observatory, SSEC/CIMSS