Graduate student’s precipitable water vapor research has important societal implications
It was June 2008 when unusually heavy rains resulted in a flash flood that broke through a dam, washing out a subdivision in the small tourist community of Lake Delton, Wisconsin.
According to the Midwestern Regional Climate Center, the average precipitation during the two weeks bookending the flood was more than five times the normal amount for the area, allowing widespread flooding to develop.
And, flood probabilities estimated from various local U.S. Geological Survey streamgages across southern Wisconsin ranged from .2 to .002, corresponding to 5-year to 500-year flooding events.
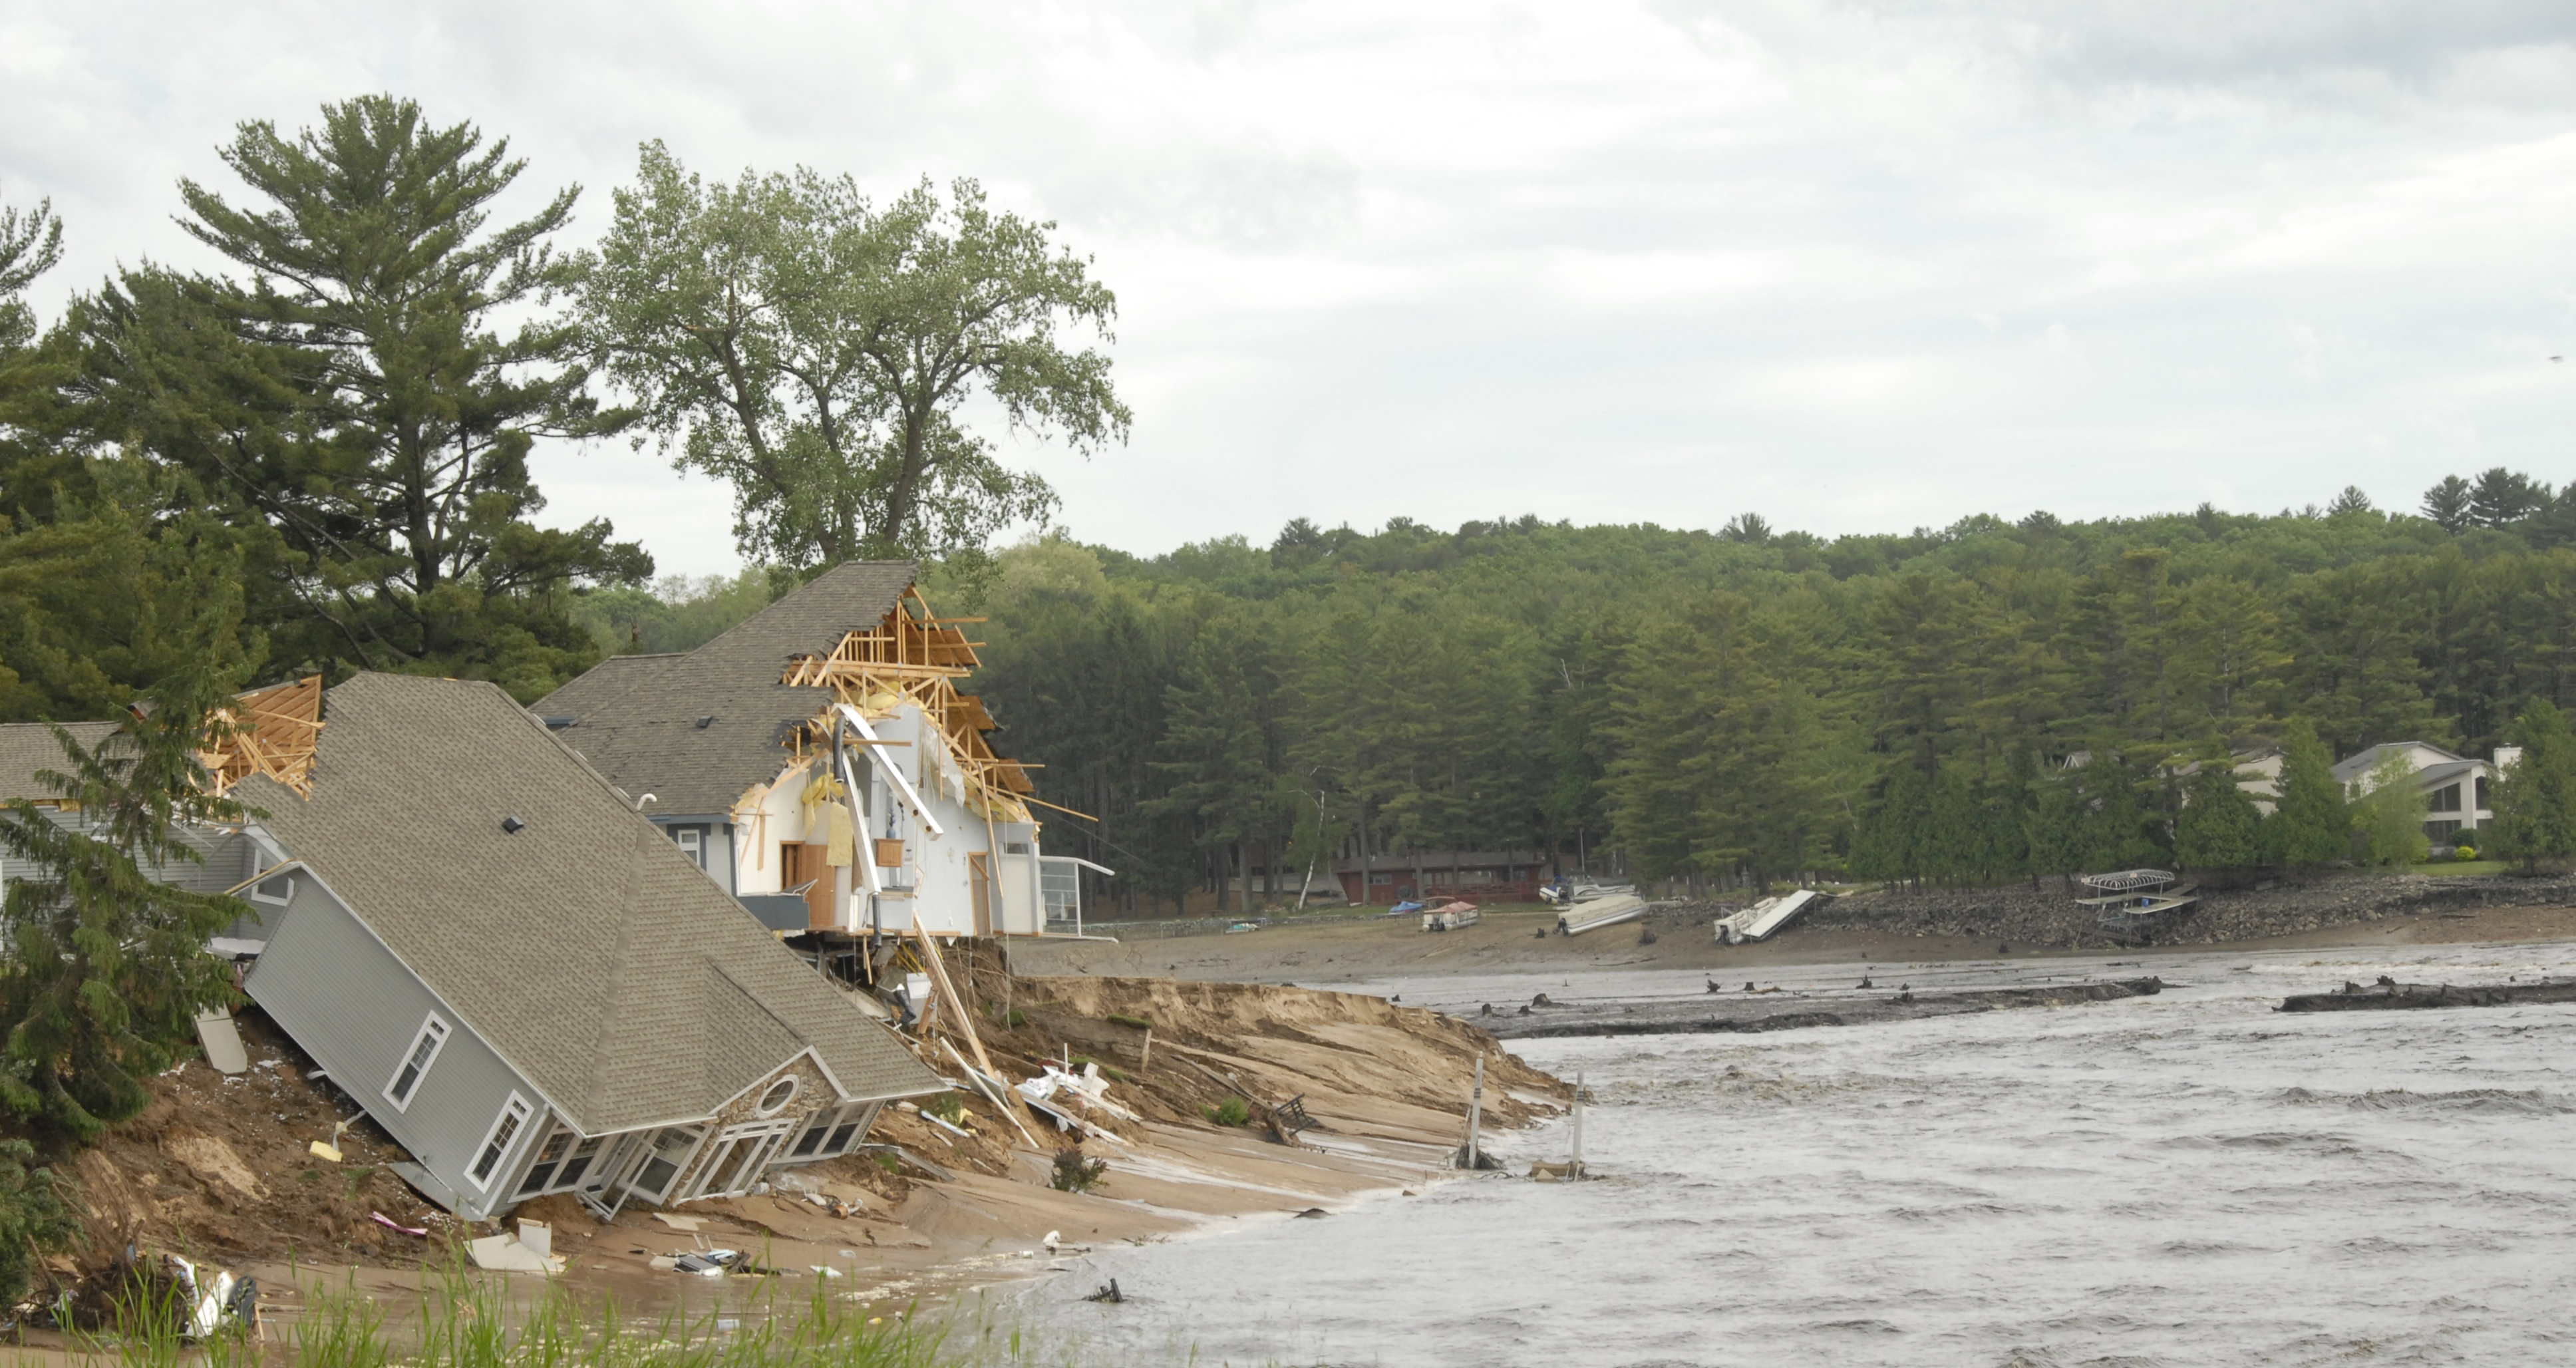
June 2008 flooding in Lake Delton, WI. Credit: Ready Wisconsin, Wisconsin Emergency Management.
It’s been more than six years, but in some ways the area is still recovering. As recently as April 2014, reported the Milwaukee Journal Sentinel, courts overturned a homeowner’s lawsuit against the Village of Lake Delton, for damages sustained in the flood.
Enter Jacola Roman, who has been interested in studying severe flash floods since she began working with Space Science and Engineering Center (SSEC) scientist Bob Knuteson as an undergraduate student, and is now continuing her work at SSEC with Knuteson as an atmospheric and oceanic sciences graduate student. Roman is well on her way to developing a highly accurate model that could be used for predicting large flooding events like the one that struck southern Wisconsin, allowing cities to better prepare for damages, injuries, and the socioeconomic costs they bring.
Anticipating these events becomes ever more important as changes in climate are expected to bring more frequent flooding, especially in the tropics, some areas of which are already economically vulnerable. Roman recognizes the need for quantitative, satellite data-based modeling of these events looking decades into the future, and, under the mentorship of Knuteson, she has investigated methods to do just that: Earlier this year, Roman was lead author on a paper published in the Journal of Climate called “Time-To-Detect Trends in Precipitable Water Vapor with Varying Measurement Error.”
Precipitable water vapor, the total depth of water in a column of the atmosphere, is the primary ingredient for heavy rains and flooding, and can be detected by satellite instrumentation on an hourly basis. Roman deals primarily with this metric, since most of the events she examines are uniquely characterized by extreme amounts of atmospheric water vapor.
“If there is enough precipitable water vapor, there is potential for convection to come in and trigger an event,” she said. “With an extreme amount, it can get pretty nasty.”
Roman’s paper incorporated data from climate models, from the CMIP3 and CMIP5 archive, to calculate the time it takes to detect a trend in precipitable water vapor. Unlike weather observing systems, which would only allow them to monitor current conditions, climate modeling systems are designed to detect trends in water vapor, temperature and other long-term factors.
In a global climate model, time-to-detect refers to the difference of two dates: the onset of a climate trend, and its actual detection by scientists. When scientists detect a trend, they will work backward to find when the trend started, at which point they are able to calculate a theoretical time value.
The study aimed to calculate the time-to-detect for 100-year trends of precipitable water vapor. Taking realistic measurement errors into consideration, Roman found that global trends ranged from 0.055 to 0.072 millimeters of precipitable water vapor per year, and varied minimally from season to season. With no measurement error, global time-to-detect was between 3 and 4.8 years.
But, a measurement error of just 5% increased the time-to-detect by nearly six times—17.6 years to 22 years—illustrating the importance of accurate measurements.
This finding also made Roman look more closely: If measurement error was affecting the time-to-detect more negatively on a global scale, maybe she should be focusing on what the zonal trends were telling her (defining zones in areas of 15 degrees latitude by 360 degrees longitude, and regions as 15 degrees latitude by 30 degrees longitude). She saw that zonal trends were highest near the equator, and that latitude had little impact on zonal time-to-detect when 5% measurement error was included. Zonal time-to-detect results were also significantly reduced, or better, when the trends were analyzed by season.
“With time-to-detect, you see bigger differences when you look very locally,” she said.
This close-up view is familiar to Roman: Zeroing in on specific regions and cities affected by flooding has become a hallmark of her work. Ever since a flood struck her home state of Minnesota in 2012, in Duluth, she has closely followed extreme flash flooding events in the news and on social media.
Roman is also a prime example of how, by bringing together bright individuals from different disciplines, universities and university-based research centers such as SSEC often spark interdisciplinary innovation. Said Knuteson, a roommate studying infectious disease in India at UW-Madison inspired Roman to research water-borne illness from flooding events extensively, one of many threads running through her body of work.
“When you have a lot of rain falling very quickly, that can affect agriculture, infrastructure, and lead to a variety of public health problems,” she said.
Knuteson described their approach to the research as an arc — building a bridge, block by block, that starts with water vapor and ends with its impact on people. Other than getting the data, developing that multi-step relationship was the most time-consuming aspect of the study, Roman added.
“There needs to be a series of connections,” Knuteson said. “Jacola looked into past studies, and those connections had not really been made yet. But, there is a community that’s studying each little piece.”
For her paper, Roman chose four regions with high population densities to use as case studies — China, India, central Europe, and the eastern U.S. — focusing on areas where large populations would be affected in the event of a flash flood. These case study regions showed that analyzing trends on a regional spatial scale, rather than global or zonal, might be the key to providing timely environmental information on highly populated regions.
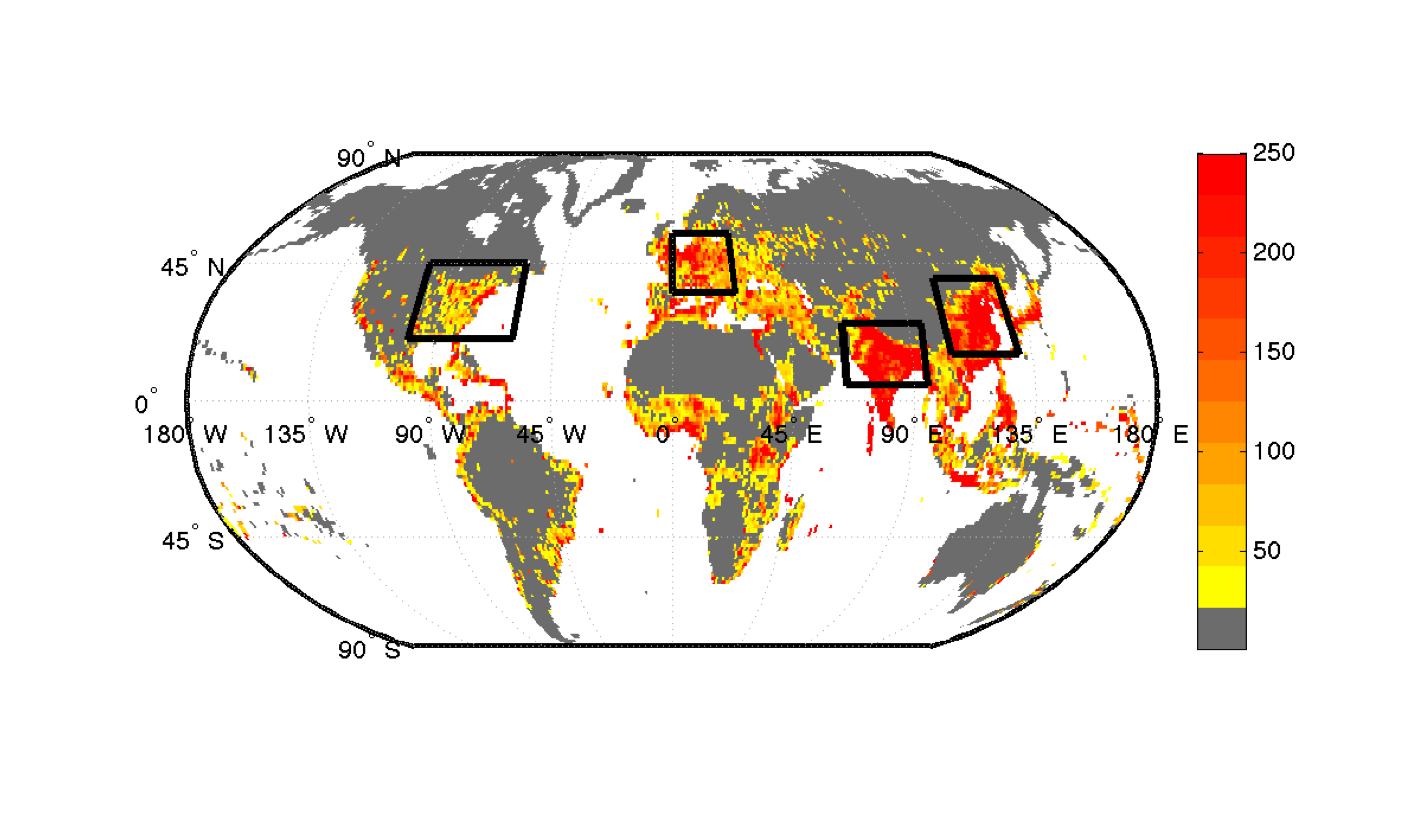
This figure, from Roman’s 2014 Journal of Climate paper, shows the population density (population per square kilometers) for 2015 with regional boundaries. She chose to focus on regions with dense populations because of their potential for severe societal impacts. Credit: Jacola Roman.
Roman gave a presentation on these findings, as well as the results of a companion paper currently under review in the Journal of Climate, “Predicted Changes in the Frequency of Extreme Precipitable Water Vapor Events,” in Berlin, Germany, in mid-October at the World Climate Research Program Global Vapor Experiment (GVAP). She addressed climate researchers from around the world, recommending measurements and sampling that, in the experience of she and her co-authors, have provided the best results for satellite remote sensing of precipitable water vapor.
Rather than mean trends, the companion paper covers trends in the frequency of extreme water vapor events. Specifically, this paper predicts that extreme water vapor events around the globe will increase in frequency in the next 100 years, likely between 2013 and 2087. On a regional, seasonal scale, the increase is shown to be even more drastic, becoming about 48 times as frequent.
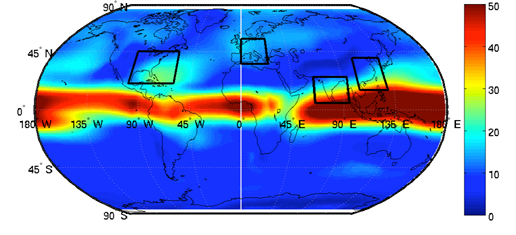
A figure from Roman’s companion paper, showing changes in frequency of flooding events over a number of years. Credit: Jacola Roman.
Hearkening back to the Lake Delton incident in Wisconsin, Knuteson explained that while a “truly destructive storm” like that may currently happen only once every 100 years, years from now, according to their model, that breed of storm could happen every decade.
“I feel Jacola is giving an important ‘heads up’ to the science community that the implications of climate change are even worse than was previously thought, and that our society needs to prepare for the worst,” Knuteson said. “In every part of the world, infrastructure has always been based on climatology of the past. But, with this change, there needs to be some warning time so we can prepare.”
Going forward, Roman will continue to investigate particular types of floods individually, such as how often the top 1% of events occurs. She is interested in one day creating a computer model that she could run for any region of the world, inputting known factors such as precipitation and watersheds, which would then predict the economic and environmental effects of flooding.
“We need to know, very specifically, how climate change will affect places,” Knuteson said.
“If we can relate the frequency of these water vapor events back to flooding events,” Roman added, “people can start preparing for future economic costs of flooding. We have had a number of events this year, even just in the U.S.”
Roman’s time-to-detect paper was co-authored with Knuteson and Steve Ackerman, director for the Cooperative Institute for Meteorological Satellite Studies (CIMSS) at SSEC. Knuteson, Ackerman, and SSEC director Hank Revercomb also contributed to the companion paper.