ProbSevere shows promise: NOAA, CIMSS statistical model highly regarded in test-runs
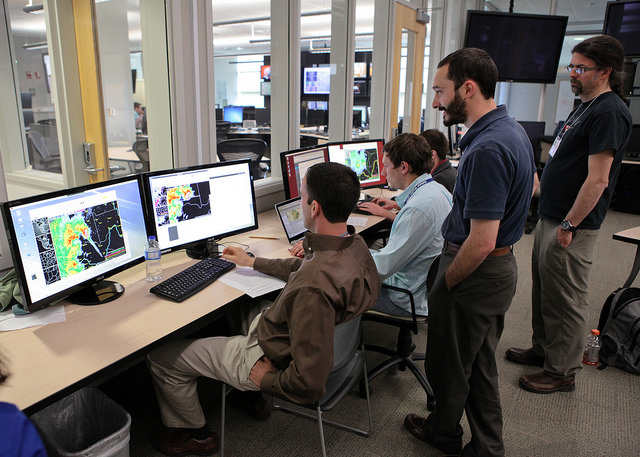
CIMSS scientist John Cintineo stands by while forecasters attending NOAA’s Hazardous Weather Testbed try out the ProbSevere statistical model. The model added at least 10 minutes of lead-time to severe weather warnings more than half of the time at the test-bed this summer. Credit: James Murnan, NOAA.
Scientists from the Cooperative Institute for Meteorological Satellite Studies (CIMSS) and the National Oceanic and Atmospheric Administration (NOAA) have developed a promising new storm-prediction model that would provide a supplement to radar, historically the most widespread and effective weather-monitoring tool for mesoscale disturbances since World War II. ProbSevere, a real-time statistical model, calculates the likelihood that a developing storm will first produce severe weather in the next 60 minutes.
“Nature, and weather, are chaotic,” said CIMSS scientist John Cintineo, lead author on the ProbSevere paper published in Weather and Forecasting in 2014.
Severe thunderstorms — those that produce hail, strong winds, and even tornadoes — are common, but often rapidly evolving and complex, making it challenging to predict which storms will become severe. More accurate probabilities enable NOAA’s National Weather Service (NWS) to issue better warnings to the public.
“Satellites have been greatly underutilized for severe weather applications,” said Mike Pavolonis, a NOAA physical scientist who leads the ProbSevere research at CIMSS, and first developed the concept for a statistical model using various inputs in late 2011. “I felt that the largely unexplored combination of satellite and radar would be extremely beneficial for short-term severe weather prediction.”
While weather radar functions by locating precipitation, calculating its motion, and offering some deductions about the type of weather that is present — rain, snow, or hail — ProbSevere is one step ahead, looking at the storm from multiple perspectives. It combines high-resolution numerical weather prediction data on environmental conditions from NOAA’s Rapid Refresh (RAP) system, GOES satellite cloud tracking and cloud growth rates, as well as radar tracking and storm intensity data from a network of NWS radar called NEXRAD, to identify and track cloud objects.
These predictors allow ProbSevere to calculate a probabilistic “nowcast,” which forecasters can analyze to determine how strong a thunderstorm might become in the next hour.
“So much of what we know about storms comes from radar. And, with radar, only when the storm has begun to produce moderate to heavy precipitation can we monitor it,” said CIMSS scientist Justin Sieglaff, who works on ProbSevere.
“Knowing the history of how the storm grew, from a satellite perspective, can give us more confidence, and potentially more lead-time to predict severe weather hazards, than with radar alone,” added Cintineo, whose background is in radar tracking.
CIMSS researchers tested ProbSevere all convective season in 2013-14, and its data have been used in forecasting imagery for several severe weather events, such as strong winds over Arkansas in July 2014, and a hail-producing storm in Texas in April 2014.
It has also been evaluated experimentally, in real time, at NWS weather forecast offices in Milwaukee/Sullivan, WI, as part of the GOES-R Proving Ground. The Proving Ground — a nationwide, collaborative effort between NASA, the GOES-R Program Office, NWS forecast offices, the National Center for Environmental Prediction, NOAA test-beds, and NOAA cooperative institutes, such as CIMSS — is intended to foster testing and feedback on experimental technologies that could be used in conjunction with the next-generation satellite, GOES-R, upon its launch in 2016. When GOES-R reaches orbit, ProbSevere will be one of the first physical science tools to deliver its benefits.
At NOAA’s Hazardous Weather Testbed (HWT) this summer, ProbSevere added at least 10 minutes of lead-time to severe weather warnings more than half of the time. The test-bed, jointly managed by NOAA’s Severe Storms Laboratory, Storm Prediction Center, and Oklahoma City/Norman NWS forecast office, is an annual event in Norman, OK, bringing together scientists, engineers, and forecasters to demonstrate new technologies.
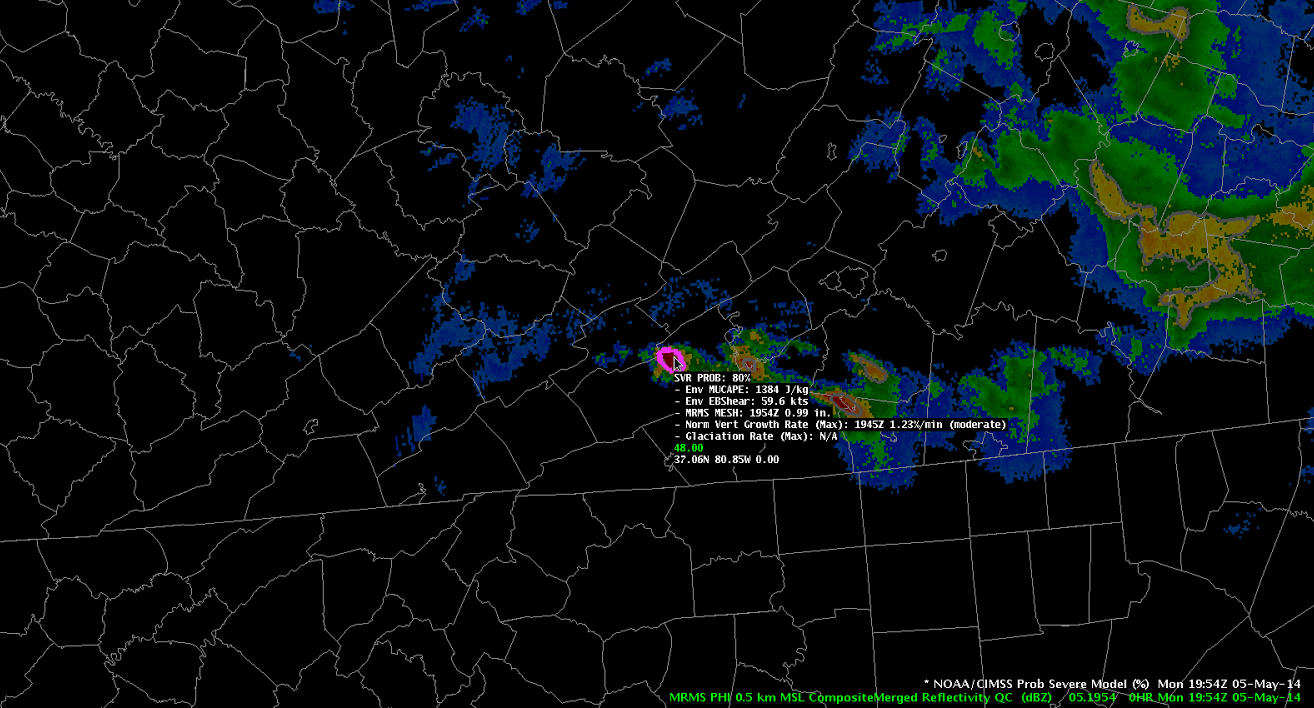
A ProbSevere display during a demonstration to National Weather Service forecasters on 5 May 2014 at the Hazardous Weather Testbed. Shown here at 1954 UTC, the model showed a probability of more than 80% for a thunderstorm in Virginia. Credit: NOAA, CIMSS.
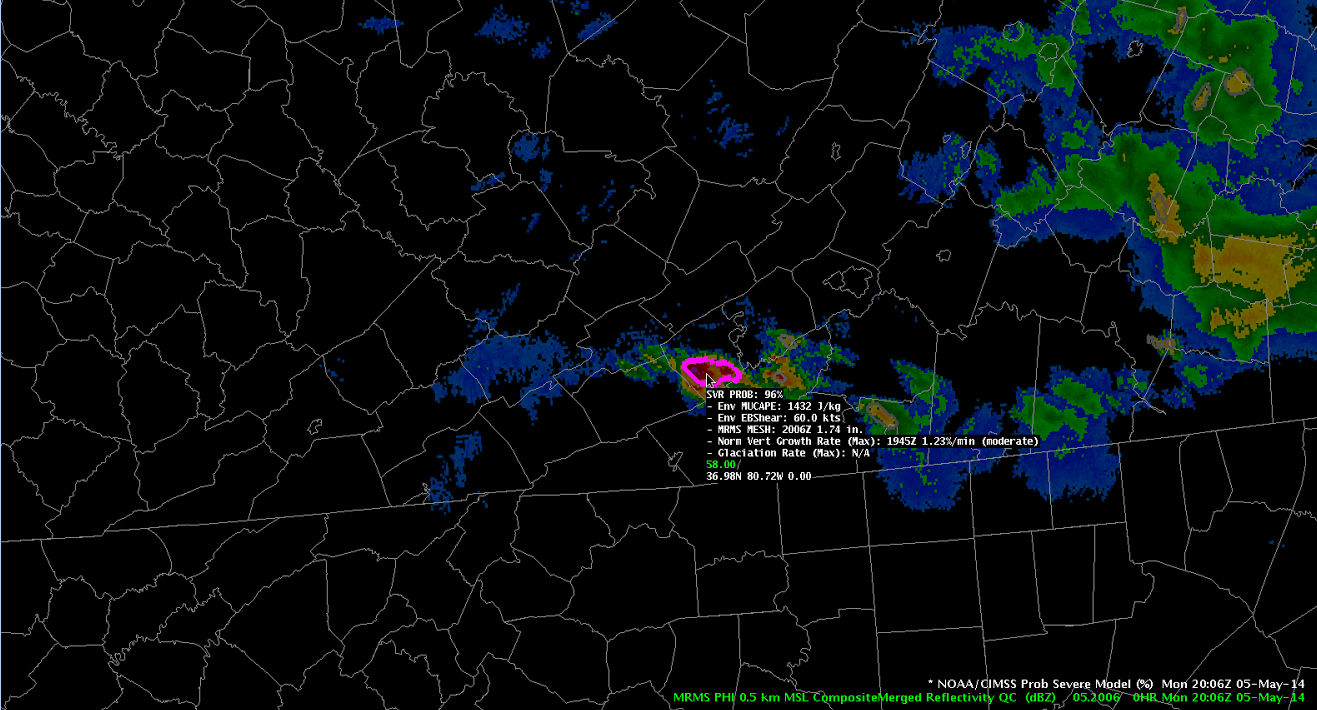
A ProbSevere display during a demonstration to National Weather Service forecasters on 5 May 2014 at the Hazardous Weather Testbed. Shown here at 2006 UTC, the model exceeds 90% probability. The NWS office in Blacksburg, VA issued a severe storm warning at 1952 UTC, and the storm went on to produce one inch of severe hail at 2009 UTC. Credit: NOAA, CIMSS.
For many HWT attendees, this was their first time seeing ProbSevere in action. The team was able to get feedback directly from users on improving its capabilities. Each week, four forecasters would test ProbSevere and other products to help them make decisions in a mock severe weather warning exercise, recalled Cintineo, who was stationed at the test-bed for two weeks in May.
“It was really enjoyable to work with the forecasters, since the whole idea of the model is to make their jobs easier,” he said. “Overall, there was a pretty favorable response.”
In particular, he said, testers appreciated how the model tied different types of information together, and the calibration of the probabilities. For instance, the model’s probabilities are given in the form of a percent — a straightforward way to communicate how many times out of 10 the user should expect a storm to produce severe weather.
“ProbSevere was a smashing success this year; it was very encouraging and rewarding to see that kind of buzz and excitement,” Sieglaff said, adding that the GOES-R programming office named ProbSevere as one of its top five products to watch in the GOES-R era.
Others at the HWT noted the usability of the display interface, Cintineo said. ProbSevere shows the location of an individual storm in a series of images, allowing the user to follow its movement and monitor a variety of properties, which Sieglaff said is an ideal way to track clouds and cloud objects, especially in real-time displays such as the NWS’ AWIPS-II.
As satellite observations are updated more frequently, and at higher resolutions, displaying gigabytes upon gigabytes of data in a manageable, user-friendly framework becomes increasingly important, explained Sieglaff.
“The way that science is going, it is impossible for one person to look at this deluge of data, so with ProbSevere we strived to distill a lot of that information into one probability,” he said, adding that the team even modeled the aesthetics of ProbSevere after the radar displays that forecasters look at during severe weather, making the user experience more familiar to them.
While this was Cintineo’s first time at the HWT, Sieglaff has made the journey the past five years, previously to present the Cloud Top Cooling (CTC) storm prediction algorithm developed at CIMSS and now for ProbSevere. Approaching deep convection somewhat differently, CTC uses frequent infrared GOES satellite observations to monitor cooling, and to determine the vertical growth rate of developing convective clouds, which, rife with water droplets and ice, are optimal for producing storms large and small. The product remains in use at CIMSS, and, in February, Sieglaff and fellow CIMSS scientists Lee Cronce and Wayne Feltz reported seeing significant improvement by incorporating GOES visible optical depth retrievals into the algorithm.
Sieglaff says years of validating the CTC algorithm, learning and getting feedback on object tracking, played a major role in preparing him for ProbSevere’s first run. Both technologies benefit from the high temporal resolution offered by geostationary satellites, which, Sieglaff says, has so far been largely underutilized for weather forecasting purposes.
“Thunderstorms develop quickly, so you need something that observes on that time-scale, which satellites do, and future satellites, like GOES-R, will do even better,” Sieglaff said.
“The ability of ProbSevere to rapidly update as new satellite and radar data come in is a huge advantage,” Pavolonis added.
Of any product Sieglaff has demonstrated at the HWT, he said ProbSevere has easily garnered the most traction. But there is still plenty of work to do. The team hopes to log more hours researching the model, to make it even better.
“Currently, ProbSevere is only able to predict severe weather in a general sense,” said Pavolonis. “We hope to develop methods to make more specific predictions such as hail versus tornado versus wind.”
This article was originally published in the Winter 2015 issue of Through the Atmosphere.