Scientists demonstrate GOES-R toolkit to “bridge the gap” between severe weather watches, warnings
by Sarah Witman
According to the National Weather Service (NWS), a “watch” indicates that severe weather may occur in a given area, while a “warning” means severe weather has been detected, and danger to life and property is imminent. The time that elapses from watch to warning is a crucial decision-making period for weather forecasters and analysts, yet there is a relative lack of observational data available to help identify short-term changes in the environment as a storm develops and intensifies.
A team of scientists from the UW-Madison Cooperative Institute for Meteorological Satellite Studies (CIMSS), the National Oceanic and Atmospheric Administration (NOAA), NASA, and the University of Alabama-Huntsville have been collaborating to develop a next-generation toolkit aimed at “bridging the gap” between severe weather watches and warnings. A paper highlighting their work was recently published in the Bulletin of the American Meteorological Society; the lead author is NOAA/CIMSS scientist Chad Gravelle.
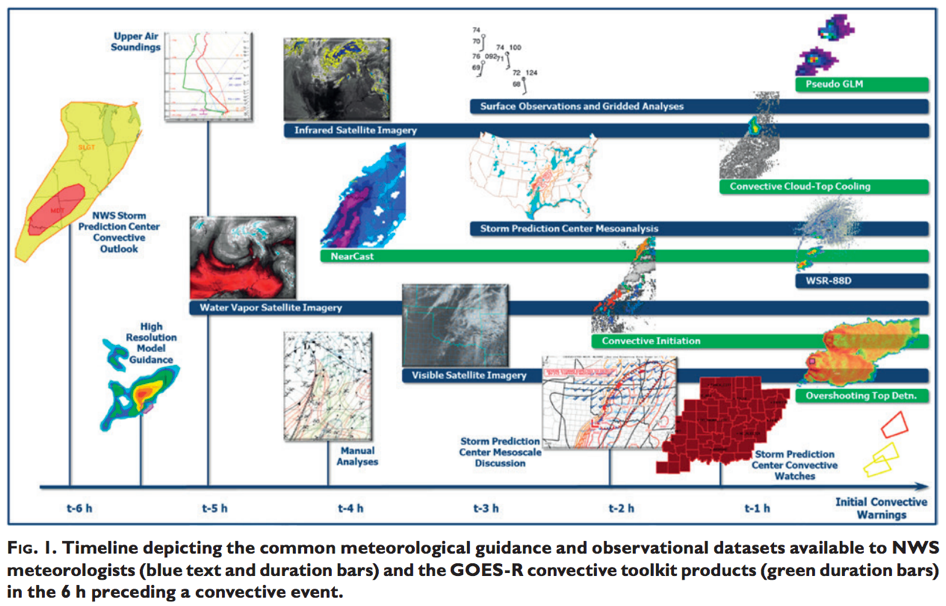
The toolkit comprises five products designed to help predict, detect, and monitor developing storms using environmental data collected via satellite:
- a NearCast model, developed by CIMSS scientist Ralph Petersen and NOAA Storm Prediction Center scientist William Line, which predicts where convection is more likely or less likely to develop up to nine hours in the future;
- a convective initiation product, developed by University of Alabama-Huntsville scientist John Mecikalski, which identifies cumulus clouds that are most likely to produce a thunderstorm in the next hour;
- a cloud-top cooling detection product, developed by CIMSS scientist Justin Sieglaff, which determines the rates at which convective cloud tops cool, as they pertain to detecting developing storms and monitoring storm intensity;
- an overshooting top detection product, developed by NASA scientist Kristopher Bedka, which detects where the strongest convective cores are located within warmer cirrus anvil clouds; and
- a pseudo geostationary lightning mapper, developed by NASA scientists Geoffrey Stano and Steven Goodman, which maps total lightning flashes onto a square five-mile grid.
The products were selected based on their efficacy and availability at the time the authors began writing the paper, although several others have been developed in the meantime, such as the ProbSevere model developed by scientists at NOAA and CIMSS.
When used in tandem, these products have been demonstrated to increase users’ situational awareness of an unfolding event. Like darning a threadbare cloth, the products can be interwoven with traditional tools to form a more complete, useful informational fabric.
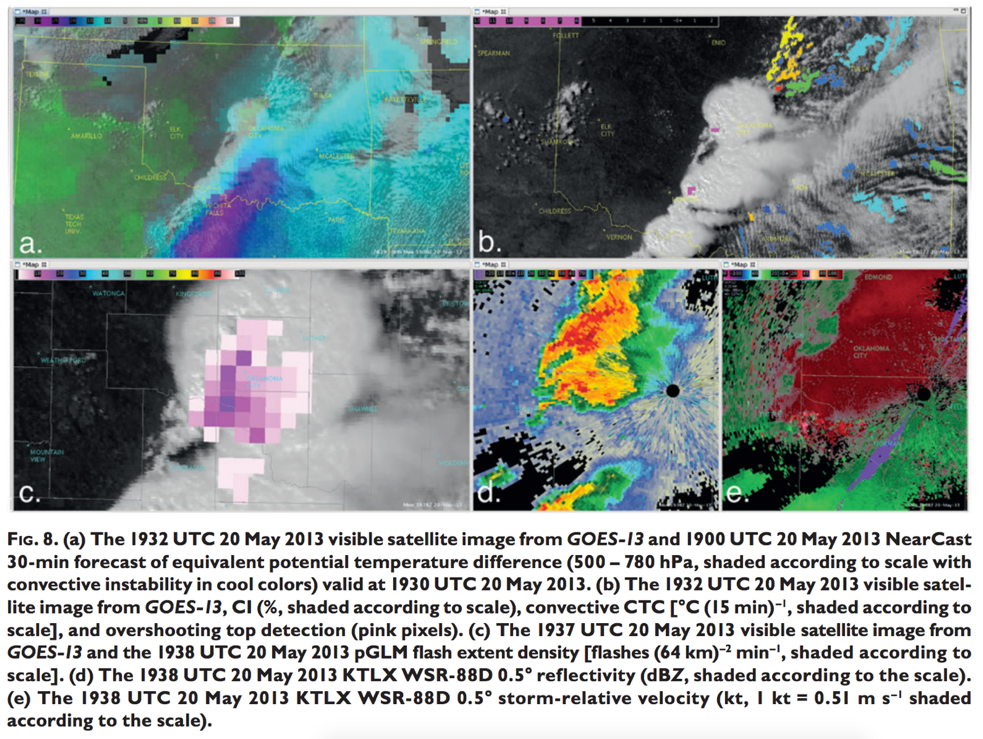
To solidify their proof-of-concept, the authors chose a case study: The May 2013 tornado outbreak in Moore, Oklahoma. This EF5 tornado intensified rapidly and became violent in a matter of minutes, claiming 24 lives and costing billions of dollars in damages.
The event in Moore had taken place less than a month before they started working on the paper, so it was a timely example of a high-impact severe weather event.
“However, in reality, you can apply this concept to any day you’re expecting thunderstorms,” says Gravelle, but he felt this event would be fresh in the minds of forecasters, making it an apt example through which to showcase the toolkit. It allowed the authors to walk the reader through a realistic scenario, step-by-step, illustrating how someone could implement the five products when monitoring for the development of convective weather.
For example, they suggest in the paper that the NearCast model, convective initiation product, and cloud-top cooling detection product could all help improve uncertainties in numerical model output, a common issue in forecasting. Simultaneously, a greater number of lightning observations from the pseudo geostationary lightning mapper and early detection of an overshooting top could benefit forecasters in a situation like the Moore event.
“We wanted to show, if the forecaster had this [toolkit] available to them, this is how they could use the products together in real time,” Gravelle says. “These datasets and products do a great job of supplementing observational datasets and surface observations to provide forecasters with important information about where and when convection may develop and how it evolves.”
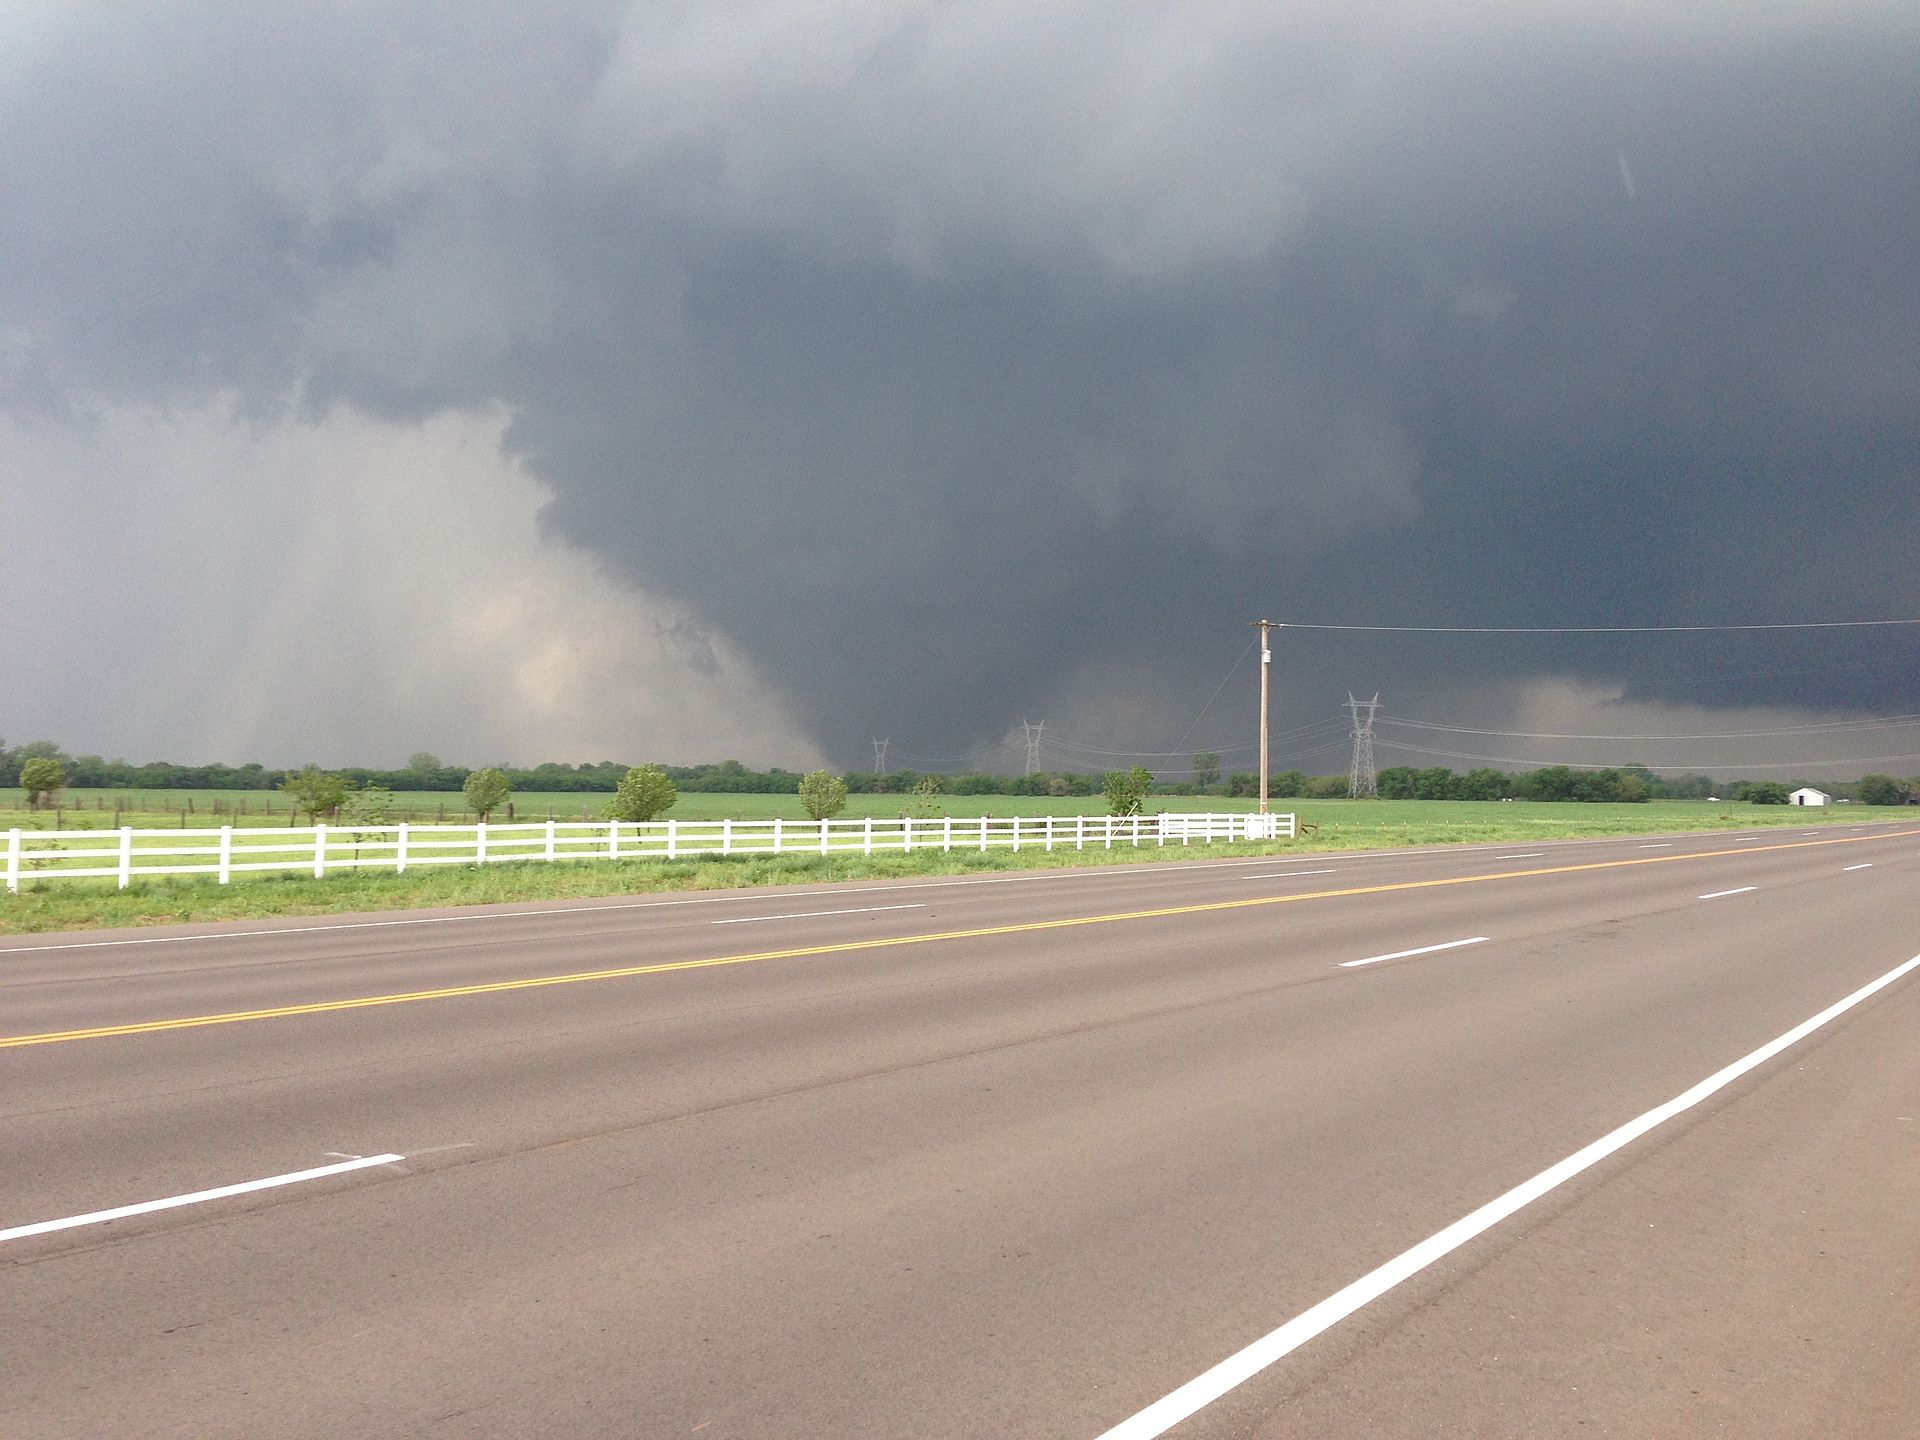
May 2013 tornado outbreak in Moore, Oklahoma. Credit: Wikimedia Commons.
For demonstrative purposes, the products have thus far incorporated data from the current GOES satellite, but the launch of next-generation geostationary satellite GOES-R in October 2016 will bring several notable advanced capabilities.
The Advanced Baseline Imager (ABI) onboard GOES-R has two visible channels, 4 near-infrared channels, and 10 infrared channels. These will provide three times the spectral information (more colors and/or types of radiation detected), four times the spatial resolution (more detail over a certain area), and five times the temporal resolution (more frequent updates) than the currently available satellite imager.
“There is a lack, currently, of observational data and datasets to monitor where convection will develop. With the advent of GOES-R, and the [forthcoming] influx of imagery and derived products, that gap [between watches and warnings] will close,” explains Gravelle. “The capabilities of GOES-R — higher spectral, spatial, and temporal resolution — will allow satellite-derived products to be produced more often and, in theory, have potentially better information come out of them.”
Post-launch, Gravelle says, scientists will be eager to incorporate GOES-R datasets into the toolkit, to see how they can enhance performance.
Additionally, advanced imagery from GOES-R is an exciting prospect that could directly benefit severe weather forecasting. While deciding whether to issue a watch or a warning during a convective event, weather forecasters and analysts often display observational datasets, including satellite imagery, on a monitor. This allows them to more easily see trends and changes in weather taking place in near-real-time. With GOES-R, Gravelle says, “the latency period of imagery from the satellite to the forecaster will be improved by almost 12 times.”
A shorter latency period has major benefits for weather forecasting, where convection evolves rapidly and changes happen every second.
“With one-minute imagery, the forecaster can actually see how convection is developing, or how mature convection is evolving, basically in real time,” he says. “Say a satellite image was taken at 1 o’clock local time. Right now, it’s not until 1:12 local time that forecasters receive that image. With GOES-R, they could be getting that image in a minute.”
The paper discusses a more comprehensive, user-customizable display that could be developed for NWS operations, integrating imagery from the five products in the toolkit. A version of such a display was tested at NOAA’s Hazardous Weather Testbed in the spring of 2014, and was met with positive reviews. According to the paper, one forecaster at the testbed commented: “I think this procedure will be of operational use, especially once GOES-R is actually launched and these products increase in overall utility.”