
[Section 5] [Home] [Section 7]
So far we have already interacted with our data and our displays in various ways. In this section we introduce a new interaction technique, the direct manipulation of data. By using a DirectManipulationRenderer we will by able to change the data value simple by dragging its depiction on the display. In other words, suppose you have an object at a given location. We will represent it by a point, or a cursor. The object's data are, for example, its position, which is given by a pair of coordinates. We shall then change the position value by dragging the cursor around the display. In this section we shall restrict ourselves to 2D, but in a later section we will use 3D displays.
We start off by defining the quantitities which are going to by drawn on the axes. We will call them northing and easting, and have created them as usual:
(These are not to be confused with the system intrinsic RealType.Latitude and RealType.Longitude.)easting = new RealType("easting", SI.meter, null); northing = new RealType("northing", SI.meter, null);
Our object, henceforth refered to as cursor, has a pair of coordinates attached to itself. These coordinates are cursor's data, which will be able to change by means of direct manipulation. The data are represented by a pair (tuple) of values. We are dealing with a tuple of VisAD Reals. Each coordinate component is given by a Real. A Real is a VisAD Data class, and we need two such objects, nicely packed in an array:
Each coordinate component has a value of 0.5. As said, we pack those inside a RealTuple, which we had declared and created withReal[] reals = { new Real( easting, 0.50), new Real( northing, 0.50) };
This is already our final data object in the example. A RealTuple represents a vector of Reals. (Note: a mathematical vector, not a Java Vector.) Real is the class of VisAD scalar data for real numbers represented as double precision floating point values, which you can access with Real.getValue(). Double.NaN is used to indicate missing values. Real objects are immutable, which means that after constructing a Real you can only reassign its value by reconstructing it. Note that there are other constructors for a RealTuple. Please consult the VisAD Javadoc for more information.RealTuple cursorCoords; cursorCoords = new RealTuple(reals);
Of course, we will also need a display and some ScalarMaps as well as a DataReference object to link display with teh cursor. First we create the DataReference and set it with the cursor's data, that is, the cursorCoords:
cursorDataRef = new DataReferenceImpl("cursorDataRef");

cursorDataRef.setData( cursorCoords );
There's no mystery about the display and its maps:
// create display
display = new DisplayImplJ2D("display0");

// create maps
lonMap = new ScalarMap( northing, Display.XAxis );
latMap = new ScalarMap( easting, Display.YAxis );

// add maps to display
display.addMap( lonMap );
display.addMap( latMap );
We are almost done. The next step would be to add the data reference to the display. However, if we do that, the cursor will be drawn in white, which is OK, but will also be dran with one pixel size, which is not OK for most displays. So we take the oppotunity to create an array of ConstantMaps, to set some cursor's attributes:
That is, the cursor will be drawn in full red, without green or blue, and will have a size of 3.5 pixels. Now we are ready to add the data reference to the display:ConstantMap[] cMaps = { new ConstantMap( 1.0f, Display.Red ), new ConstantMap( 0.0f, Display.Green ), new ConstantMap( 0.0f, Display.Blue ), new ConstantMap( 3.50f, Display.PointSize ) };
Note the method's name, it is addReferences and not addReference as we've seen so far in this tutorial. Also note that the method takes as parameters a DirectManipulationRendererJ2D as well as the usual DataReference and array of ConstantMaps. Next we pack the display inside a JFrame and show it, as we've done so many times before.display.addReferences( new DirectManipulationRendererJ2D(), cursorDataRef, cMaps );
Running the program above (the complete code is available here) with "java tutorial.s6.P6_01" generates a window like the screen shot below.
Clicking the right mouse button on the cursor and dragging it will move the cursor about. Note that by doing this, you will by changing the value of cursorCoords. In this example this is not very exciting. You're are "just" moving a cursor about. If, however, you have other data linked to or dependent on cursorCoords, with dragging you can then change those other data, too. You should also try changing the ConstantMaps, or even setting it to null, in which case you should get a minute white cursor. It still draggable, though. That is, if you can click on it!
In practice you'd use the DirectManipulationRendererJ2D to change other data and/or provide more interactivity to your application. In the next section we shall do something more useful with a "directly manipulatable" cursor.
The starting point is the previous example. The major addition is the surface of section 3.1, which was defined as a FlatField. We have trimmed example P3_5 into a new class, called Surface. Surface has a method called getData, which returns the FlatField. The idea is to have the cursor floating over the surface, so that when we move the cursor, we get some information about the field. We are then ready to create the Surface object, and get its FlatField, which we called surfsField:
The last two lines above create and set a new data reference object for the surface. Later we will link the surface to the display with this data reference.Surface surf = new Surface(); surfsField = surf.getData(); surfDataRef = new DataReferenceImpl("surfDataRef"); surfDataRef.setData(surfsField);
But how do we calculate the value of the function (FlatField) at the cursor position and when do we do that has yet to be explained. The "when" is simply every time the cursor changes. In other words, every time its data value changes. We use a CellImpl, whose doAction() method will contain code to evaluate the field at the given position. Linking the cell to the cursor's data reference will make sure doAction() gets called every time the cursor changes position. We create the CellImpl and implement its doAction() with:
In other words, when the method is called, we get the data object attached to cursorDataRef, which we know is a RealTuple, so we cast the Data to it and define coords as the new cursor coordinates. We then want to retrieve each coordinates component value, so withCellImpl cell = new CellImpl() { public void doAction() throws RemoteException, VisADException { // get the data object from the reference. We know it's a RealTuple RealTuple coords = (RealTuple) cursorDataRef.getData(); // then break the tuple down its components Real lon = (Real) coords.getComponent(0); Real lat = (Real) coords.getComponent(1); // print the value of each component System.out.println("Cursor at: (" + lon.getValue() + ", " + lat.getValue()+ ")"); // Evaluate the value of the function // temperature = f( easting, northing) // at the cursor position Real tem = (Real) surfsField.evaluate(coords); System.out.println("Temperature = "+ tem.getValue() ); } };
we get the first component, easting. We do the same for northing and print the cursor's new coordinates, whose component double values we got with getValue(). Next we evaluate the value of the field at the cursor position. For that we use the method Function.evaluate(RealTuple domain). Remember, Function is an interface which is extended by the Field interface, which is implemented by FieldImpl which is extended by FlatField.) To put it in another way:Real lon = (Real) coords.getComponent(0);
evaluates the function at coords and return a Data object, which we cast to Real. in mathematical notation the FlatField surfsField represents temperature = f( northing, easting). Function.evaluate(coords) thus is the same as temperature = f( new_long_value, new_lat_value). Note that with another function, the returned data might be of a different type. But here we know it's a Real. After that we print the temperature value. Of course, we can't forget to add the cursor's data reference:Real tem = (Real) surfsField.evaluate(coords);
This will make sure doAction() gets called every time the data under cursorDataRef changes (when the cursor moves).cell.addReference(cursorDataRef);
Note that the cursor is now white. We simply changed the ConstantMaps a little. We have also added an
to the display, to color the surface according to the temperature value.rgbMap = new ScalarMap( temperature, Display.RGB );
You can see these changes in the code available here. Run the example with "java tutorial.s6.P6_02" and you'll see a window like the picture below.
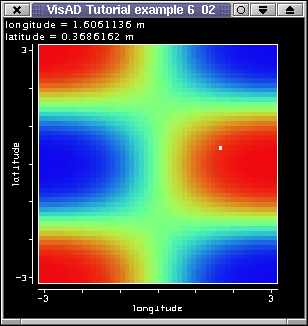
The cursor dynamic matches that of the previous examples. Clicking on the white cursor with the right mous button and dragging it will run the code in doAction(). Information about the cursor's position and the temprature value at that point will be printed out (on the terminal window).
Before we move on there's a point or two to be considered. The VisAD FlatField represents a finite set of (temperature) samples. The function this Field represents is, however, continuous. In practice, this means that the values you're seeing printed out are "interpolated" values. You can actually choose the interpolation method. The method Function.evaluate() has other forms. For example, the method
Will evaluate the Function at domain with non-default modes for resampling and errors (which are Data.WEIGHTED_AVERAGE and Data.NO_ERRORS). Availbable interpolation (sampling) modes are Data.WEIGHTED_AVERAGE and Data.NEAREST_NEIGHBOR and other available error modes are Data.INDEPENDENT and Data.DEPENDENT. Just a final note before we move on: if you move the cursor outside the surface, that is, where the function is not defined, you will get missing data, in form of NaN's (Not a Number), being returned.evaluate(RealTuple domain, int sampling_mode, int error_mode)
We start off by thinking that our surface has a Linear2DSet with manifold dimension equal to 2. That is, it is a regular grid. If the 2D domain set had manifold equal to 1, then it'd represent a line in 2D space. Surely, if your set has just one point, than it does not represent a line, but just a single point, pretty much like our cursor so far. You can construct a 2D set with 1 point using:
Where lengthX = 1 and type is the domain type:Gridded2DDoubleSet(MathType type, float[][] samples, int lengthX)
samples is the location of the points, and length is the number of points (for us one point will do).type = new RealTupleType(easting, northing);
The idea is, whenever the cursor is moved, our Cell doAction() will execute and that means getting the cursor location, like before, and with this location, we will resample our 2D field (the surface) to a 2D point. We will finally print the value (temperature) we got, just like in the previous example.
Our new doAction() also start with getting the cursor's position:
We then break the tuple down its componentsRealTuple coords = (RealTuple) cursorDataRef.getData();
and finally create the set:Real lon = (Real) coords.getComponent(0); Real lat = (Real) coords.getComponent(1);
Take some time to analyze how the array samples is organized:int numberOfPoints = 1; Gridded2DDoubleSet new2dSet = new Gridded2DDoubleSet( domain, new double[][]{{x},{y}}, numberOfPoints);
If we had a line with multiple points in 2D, samples would be:samples = new float[ domainDimension ][ numberOfSamples];
samples = {
            {x1, x2, x3, ...},  // x values
            {y1, y2, y3, ...},  // y values

          };
Note that we chose a Gridded2DDoubleSet because the samples were already doubles. If we had floats we could have also chosen a Gridded2DSet. We are then ready to resample with
In other words, we resample the surface with a different 2D set, and now with non-default resampling and error modes. (Remember, the surface has a Linear2DSet but our new set represents a point in 2D space.) The method returns a FlatField whose domain set is the new Gridded2DDoubleSet. That is, it still represents a function temperature = f(easting, northing), also written as ((easting, northing) -> temperature ), but it has just one point as it domain set. We don't need this temporary field for long, so we get all temperature values stored in it:FlatField temporField = (FlatField) surfsField.resample( new2dSet, resampMode, errorMode ); );
Now we have all temperature values associated with this FlatField. That is, we have a single temperature value, stored in:double[][] tem1 = temporField.getValues();
which we print. Still we calculate the temperature almost like we did in the previous example:tem1[0][0]
but also with user defined resampling and error modes. The temperature values, calculated with both methods are printed out when the cursor is moved. Please run the code with "java tutorial.s6.P6_03" and you'll see a window like the picture below.Real tem2 = (Real) surfsField.evaluate( coords, resampMode, errorMode );

There shouldn't really be any difference between the evaluated and the resampled value, although they are calculated in quite distinct ways. If you're feeling very brave, you can try changing resmpling and error modes to see if you get any differences between the values, just uncomment the appropriate lines in the code. Off course, evaluate() and resample() don't have to have identical modes. You could also experiment with the size of the surface. You could, for example, enter different dimensions directly in the Surface code, or even change the code to let the surface interpolate itself (downscale or upscale) before you display it. Note that, this is the "classical" way to interpolate, say, a line in VisAD. You simply create a larger domain set (by defining more points) and call resample() with this set as a parameter. Another example would be resampling an image so that its new size matches the size of another picture you want to compare.
So, the question left in the air is simply: when should I resample and when should I evaluate a function. Evaluate is simply to get the value of a field at a given location. That is, you are restricted to the current data structure. Resample, on the other hand, changes the data structure (but not the MathType!), which you can use in other different ways. For example, if you had a line crossing the field, then you could display the intersection of line with the surface as a graph of the temperature along the line. By feeding resample() with the "right" set, you can easily get this line. We'll do it next.
In this section we'll show how to combine the interactive cursor with a line. The result will be a movable line, which will "sample" the surface. The actual (re-)sampling of the surface into a line will be done in the next section. Here we'll only create the line and make it movable.
We shall call our movable line the white line, and it is given by:
private Set whiteLine;
It will need its own data reference:
private DataReferenceImpl wLineDataRef;
The cursor in this example, however, doesn't need a pair of coordinates. It's position will simply be given by the northing value it is at. The reason for that is simply that we want the line to cut the surface in the horizontal direction. That is,the northing for a given line is constant. Our cursor position, so far given by a RealTuple is now given by a Real:
double initLatitude = 0.50;
cursorCoords  = new Real(northing, initLatitude);
To create the white line we use the method
The method takes the current northing and the number of points the line will have as parameters. We fix the easting min and max values to be -4 and 4, respectively. We then create the array which will hold the line samples (points) and loop over the number of points to set their values. Latitude is constant and easting gets incremented. The method returns a Gridded2DDoubleSet, our new white line.private Set makeLineSet( double northingValue, int pointsPerLine ) throws VisADException, RemoteException { // arbitrary easting end values of the line double lowVal = -4.0; double hiVal = 4.0; double[][] domainSamples = new double[2][pointsPerLine]; double lonVal = lowVal; double increment = ( hiVal - lowVal )/ (double) pointsPerLine ; for(int i=0;i < pointsPerLine;i++){ domainSamples[0][i] = lonVal; domainSamples[1][i] = northingValue; lonVal+=increment; } return new Gridded2DDoubleSet( domain, domainSamples, pointsPerLine); }
This method will be called every time the cursor moves. But we also need to create the line for the first time:
Let's not forget the data reference:int numberOfPoints = 100; whiteLine = (Set) makeLineSet(initLatitude, numberOfPoints);
wLineDataRef = new DataReferenceImpl("wLineDataRef");
wLineDataRef.setData(whiteLine);
The new features in the doAction() are the lines
which, just like above, will (re-)create the white line, andint nOfPoints = 100; whiteLine = (Set) makeLineSet(latValue, nOfPoints);
which will reset the data, and, thus, will update the display. We also can't forget towLineDataRef.setData(whiteLine);
display.addReference(wLineDataRef);
otherwise our diplay won't show the line.
Note that this time we have extended the array of ConstantMaps in order to be able to set a fixed cursor easting (x-axis) position:
The new ConstantMap( 1.0f, Display.XAxis ) means that the cursor will have a fixed x-value of 1.0, which puts the cursor on the box right hand side. (Remember, the VisAD display is originally a box of side equal to 2 and centered in (0,0,0).) If you uncomment this line, the cursor will be draw at (0, initialLatitude), that is, northing will change, but the easting value will always be the middle of the x-axis.ConstantMap[] cMaps = { new ConstantMap( 0.0f, Display.Red ), new ConstantMap( 1.0f, Display.Green ), new ConstantMap( 0.0f, Display.Blue ), new ConstantMap( 1.0f, Display.XAxis ), new ConstantMap( 3.50f, Display.PointSize ) };
You can have a look at the code, run it with "java tutorial.s6.P6_04" and you'll see a window like the screen shot below.
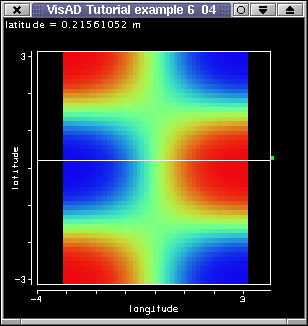
Pressing the right mouse button on the cursor and dragging it will make the white line move. The cursor has now only one degree of freedom, northing. Longitude is fixed by the ConstantMap. When the cursor moves, doAction() is called, as usual. This method gets the current northing value, reconstructs the line at this new northing and resets the cursor's data reference to update the display. Well, everything quite simple. What if we create a new function, say a FlatField like the surface, just by resampling the surface with the white line Set? Let us try that next.
We start of by declaring the temperature line and its data reference
private FlatField temperLine;
private DataReferenceImpl tLineDataRef;
Beacuse we will now have two display we changed our display variable into
private DisplayImpl[] displays;
Above there's no definition whether the displays are 2- or 3D. A DisplayImpl can be either. We will use two 2D displays, but in the next section we will include code for a 3D display.
After we create the white line exactly as we did above, we can create the temperature line for the first time:
temperLine = (FlatField) surfsField.resample( whiteLine);
Let's take some time to analyze the line above. temperLine is a FlatField create from the resampling of surfsField, also a field itself. The resampling parameter is the white line Set, whose domain is the same as the surface's:
temperLine is not a line like the white line. The white line is a "simple" line (that is, it's only a Set), whereas temperLine is a more complex line. In fact, temperLine represents the function(easting, northing)
exactly in the same way the surface does, only that the temperLine function is sampled along a line. We could also create a Linear2DSet (or a Gridded2DSet with manifold dimension = 2) and feed resample() with it. The result would be a larger or smaller surface depending on the number of points this new set had. (Of course, the domain of this new set has to equal the domain of the original surface.) The point we want to make here is, the temperature line represents a function and the white line represents a Set (a simple line).( (easting, northing) -> temperature )
Before we move on, we can't forget the new data reference for the temperature line:
tLineDataRef = new DataReferenceImpl("tLineDataRef");
tLineDataRef.setData(temperLine);
The method doAction() has yet newer features:
After we create the new white line (see previous example), we resample the surface with this new white line (Set) and get a new function returned, the temperature line at the cursor northing and along the easting values. The second line above simply tells the temperature line's data reference that the data object has changed, this will update the temperature line on the second display.temperLine = (FlatField) surfsField.resample( whiteLine); tLineDataRef.setData(temperLine);
We now want two displays, so we do:
and also turn their axes on withdisplays = new DisplayImpl[2]; for( int i = 0; i < 2;i++){ displays[i] = new DisplayImplJ2D("display" + i); }
for( int i = 0; i < 2;i++){
  GraphicsModeControl dispGMC =
    (GraphicsModeControl) displays[i].getGraphicsModeControl();

  dispGMC.setScaleEnable(true);
}
The first display will keep its maps, but we need new ScalarMaps for the second display. You cannot add the same map to different displays. But you can clone them:
displays[1].addMap( (ScalarMap) lonMap.clone() );
displays[1].addMap( (ScalarMap) rgbMap.clone() );
That is, display1 has the same easting (x-axis) and temperature (rgb-color) maps as display0. Note that you can get the maps of a display with:
and then perhaps add to your second display withVector mapsVec = displays[0].getMapVector();
for( int i = 0; i < mapsVec.size();i++){

  ScalarMap sm = (ScalarMap) mapsVec.get(i);
  displays[1].addMap( sm.clone() );
}
Next we add the cursor's, the surface's and the white line's data references to display0 and the temperature line's data reference to display1. This last action is done with:
That is, first create ConstantMaps for larger points and then add the temperature line's reference with those ConstantMaps.ConstantMap[] tLineMaps = { new ConstantMap( 2.0f, Display.PointSize ) }; displays[1].addReference(tLineDataRef, tLineMaps);
The two displays are added to our JFrame with:
jframe.getContentPane().setLayout(new GridLayout(1,2) );
jframe.getContentPane().add(displays[0].getComponent());
jframe.getContentPane().add(displays[1].getComponent());
where the first line of code is the interesting: we need to set a nicer layout, so that the displays will grow with the size of the JFrame, whose width we have doubled to acomodate two displays.
You can get the code here. If you run it with "java tutorial.s6.P6_05" and you'll see a window like the picture below.
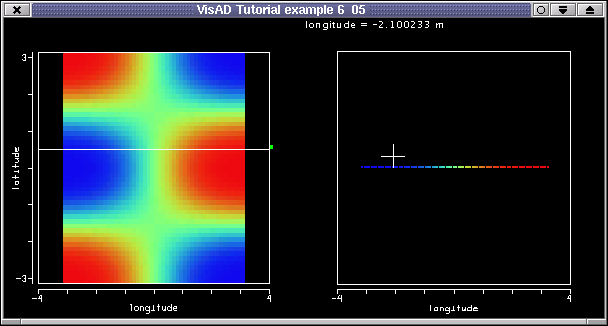
The left side shows a display just like the one of the previous example. The right side has a new display, which shows the temperature line at the position of the white line on the left display. If you move the cursor up and down, the temperature line will be recalculted and redisplayed on te right. Note that the white line is somewhat longer than the surface's width. The temperature line is as long as the white line. So, what's happening on the edges, where the white line exists but where there's now surface? Remember what happened in section 6.2, when you moved the cursor out of the surface? The method Function.evaluate() returned NaN's. This is exactly what's happening with the edges of the temperature line. There, the temperature is not defined, and, thus, the temperature values are NaN's, which are not drawn.
Before we move on, we'd like to leave a question floating on the air. We've talked the whole time about temperature line, but we added this "line" to the display with an array of ConstantMaps. Isn't this contradictory? We'll look into this further.
The starting point is the previous example. Everything is the same, except after we get the cursor data in the doAction(). Here, before we update the line, we want to check whether the cursor has moved significantly. We could build our own test by getting the cursor's old data and comparing with the new value, but we choose to use a method from the visad.util package:
// first get the current cursor northing
Real lat = (Real) cursorDataRef.getData();

// then test if value has changed more than 0.2
if( Util.isApproximatelyEqual( lat.getValue(), cursorCoords.getValue(), 0.2 ) ){

  return; // leave method and thus don't update line
}
That is, we use the method Util.isApproximatelyEqual( double a, double b, double epsilon) to determine whether two numbers, the new value and the old value, are roughly the same. Here we chose epsilon (the absolute amount by which they can differ) to be an arbitrary 0.2. This means that the new lines are created after we move the cursor about 0.2 in the northing direction. If we move less than 0.2, the doAction() returns (that is, nothing happens). At the end of doAction() we can't forget to set the cursor data to be the current value:
cursorCoords = lat;
This is not the only optimization doAction() includes. Now we create the new white line with two points only, the start and the end point:
Why we do this? Well, why not? We only need two points to define a straight line. Furthermore, the display won't have to recompute and then redraw all 100 points we had for the white line. For the temperature line we create a set with 100 points, like we had so far.int nOfPoints = 2; whiteLine = (Set) makeLineSet(latValue, nOfPoints);
temperLine = (FlatField) surfsField.resample( makeLineSet(latValue, 100) );
We also add a new map to the second display:
displays[1].addMap( new ScalarMap( temperature, Display.YAxis) );
This will make the temperature line stretch out in the y-direction according to its temperature values. Now you must see that the temperature line is not a line. All the rest is done like in the prvious example.
You can get the code for this example here. If you run it with "java tutorial.s6.P6_06" and you'll see a window like the picture below.

Moving the cursor updates the white line and the data object on the second display. This update occurs only if we move the cursor by more than 0.2 of northing. The white line has now only two points, although one can't see any difference. What needs explanation is perhaps the fact that the so-called temperature line is made of points. The reason for that lies in the fact that the white line is a line in the 2D (easting, northing) space. The temperature line is also a line in this space. In the second display, though, we don't have this space, but a (easting, temperature) space, in which the values are points. If you need more convincing, then uncomment the following line in the code:
In order to do this, you also need to change your DisplayImplJ2D to a DisplayImplJ3D:displays[1].addMap( new ScalarMap( northing, Display.ZAxis) );
This will make the second display a 3D display, and:displays[1] = new DisplayImplJ3D("display" + 1);
which will add a northing map in the z-axis. Well, if you do so (the code lines above are already included in the code for this example) then you should see a 3D display on the right, showing a line with MathTypedisplays[1].addMap( new ScalarMap( northing, Display.ZAxis) );
and maps like((easting, northing) -> temperature )
easting -> XAxis
northing -> ZAxis
temperature -> YAxis
Please note that the
has now no effect.ConstantMap[] tLineMaps = { new ConstantMap( 2.0f, Display.PointSize ) };
We answered a question but are then ready to throw two others in the air. First, how do we make a "real" line, that is a function like those seen in sections 1 and 2. (We mean a function like ( easting -> temperature ).) And secondly, is it possible to have a line in some direction other than only northing or only easting? Second answer first: yes, you could have any line; for example a line in the diagonal, as long as you feed your white line set with the correct values (which you'll have to calculate manually; an alternative would be to have two cursors, on on each line end, and from their coordinates, calculate the coordinates of a number of points between them). You could also have the whole thing in three dimensions. Just create the cursor with the adequate RealTuples and an adequate 3D line (or plane!).We'll do a couple of 3D examples shortly. First we turn our attention to generating a line function with the values we get from the resampling.
The main idea in this example is the transformation of a 1D FunctionType into a 2D type. Of course we could create a 2D type by brute force, but VisAD offers us a convinient method for doing such a transformation. Consider the following String, which represents the MathType of a variable as a function of another:
So far our "lines" had a FunctionType like ( (easting, northing) -> temperature ). This is also the MathType of the surface. (Remember, the difference between the surface's domain and the object returned by the resampling the surface lies in the manifold dimension. The surface has manifold dimension equal to 2 and the resampled object - our collection of points - has manifold dimension equal to 1, that is, a line in the space defined by the RealTypes easting and northing.) To convert the MathType into the simpler type we can do:String newFuncStr = "( easting -> temperature )";
That is, lineType is our new type, created from the surface's type. It represents a variable (temperature) as a function of another variable (easting). (Whether the data object with this type will in fact be a line will depend on the domain set. But we'll make sure we'll choose an appropriate Set.) The static method MathType.stringToType( String newMathType ) could also be used, or we could have created the function with a FunctionType constructor. Finally note that we cast the returned MathType into a FunctionType.FunctionType lineType = (FunctionType) surfsField.getType().stringToType( newFuncStr ) ;
We now turn our attention to the domain set of our newly created function. As said, we want a 1D Set, and we simply opt for a Gridded1DSet:
The temperature line set is a 1D set, whose domain type is easting, whose samples istLineSet = new Gridded1DSet( easting, new float[][]{lonSamples[0]}, numberOfPoints);
simply extracted from the white line; the number of points in the set has also been given in the constructor.float[][] lonSamples = whiteLine.getSamples(false);
We're ready to create the actual temperature line, using our freshly created MathType and Set, which are lineType and tLineSet , respectively:
We now only need the actual temperature values and our FlatField will be ready to be displayed.temperLine = new FlatField( lineType, tLineSet );
This is quite a bit in one line! We are setting the temperature values with values extracted from the surface. Those values are the floats from the surface (also a FlatField), resampled with the whiteLine. Note that we don't make a copy of those floats when we get them (the first false) nor do we make a copy of them when feeding the field (the second false). This field is ready to be displayed for the first time. We just can't forget to create a data reference for it and set the reference with the the field, like we've done many times before. The basic framework is ready. We need to implement this logic in the Cell.doAction, to create a new line everytime the cursor moves. The method is implemented as follows:temperLine.setSamples( surfsField.resample( whiteLine).getFloats(false), false);
That is, we get the data object associated with the data reference cursorDataRef and we check whether it's worth resampling the line, that is whether the cursor moved enough. If yes, we carry on and get the northing value, which we need to make the new white line. This new line has start and end points only, and we re-set its data reference, so that the display will be updated.CellImpl cell = new CellImpl() { public void doAction() throws RemoteException, VisADException { // get the data object from the reference. We know it's a RealTuple Real lat = (Real) cursorDataRef.getData(); // test if cursor postion (northing) has changed significantly if( Util.isApproximatelyEqual( lat.getValue(), cursorCoords.getValue(), 0.1 ) ){ return; // leave method and thus don't update line } //... };
The next step is to create another "white line", but which won't be displayed. This line will be used to resample the surface. (Remember, the white line above is for display purpose only. The next "white line" is used as resample parameter.)double latValue = lat.getValue(); // make a new line for display 1: will have only 2 points int nOfPoints = 2; whiteLine = (Set) makeLineSet(latValue, nOfPoints); // Re-set Data, will update display wLineDataRef.setData(whiteLine);
This is almost exactly the same as we did just before the Cell.doAction. We don't draw the object we got from resample. We create a new function, based on a new MathType, create a new 1D Set and use the temperature values of the resampled object to feed the new function. The only diference to the approach before doAction is the use of the static method// now create a larger white line set to compute the temperature line nOfPoints = 100; whiteLine = (Set) makeLineSet(latValue, nOfPoints); // get samples from white line float[][] lonSamps = whiteLine.getSamples(false); // create line function set tLineSet = new Gridded1DSet( easting, new float[][]{lonSamps[0]}, nOfPoints); // fuction will have this type String funcStr = "( easting -> temperature )"; // create Function (FlatField) and set the data temperLine = new FlatField( (FunctionType) MathType.stringToType( funcStr ), tLineSet ); temperLine.setSamples( surfsField.resample( whiteLine).getFloats(false), false);
To create the new FunctionType from a String. As said, this is only an approach to illustrate the use of some VisAD data object's methods. In practice you would use stringToType to parse some user input in form of a String, perhaps when reading data from an ASCII file. VisAD's visad.data.text.TextAdapter does just that. Please refer to its code, which you'll find in your VisAD directory (in the subdirectory data/text). The final steps in the doAction() are to update the reference, which will update the temperature line on the right display and then to set cursorCoords to the current value, so that next time the cursor moves, we can check if the new value differs from the older by a significant amount.MathType.stringToType( funcStr )
In fact, this example has brought so far, nothing new. We have just combined data data obejcts of diferent dimensions and have used the temperature values of one, to feed the other data object. The basic logic was really taken from the previous examples. There's still time to add something useful and enhance our mini application::// and update ist data reference -> will update display tLineDataRef.setData(temperLine); // assign current cursor position to old cursor position cursorCoords = lat; } };
Well, we can't really claim we're introducing something new. We saw the VisADSlider back in chapter 5 (see for example section 5.7). The line above creates an instance of the VisADSlider. The parameters are a data reference, minimum, maximum and start values for the slider, the RealType easting and the label the slider will have. The really interesting thing about this slider is that, when the data object linked to the data reference cursorDataRef changes, the slider will change accordingly. Tat is, the slider accompanies the cursor and vice-versa.VisADSlider latSlider = new VisADSlider(cursorDataRef, -4, 4, 0, northing, "Northing");
Another little modification is the use of ConstantMaps to define some attributes of the white line:
The color maps are somewhat redundant, as they define a white color for a line which already was white. But you are free to define your own favorite color by changing the values of the components. (Bear in mind that those values must be floats between 0 and 1.) The last maps sets the line width. You'll notice that the line is now slightly wider. The array of ConstantMaps serves as parameter when adding a data reference to a display, as we know:ConstantMap[] wLineMaps = { new ConstantMap( 1.0f, Display.Red ), new ConstantMap( 1.0f, Display.Green ), new ConstantMap( 1.0f, Display.Blue ), new ConstantMap( 3.50f, Display.LineWidth ) };
The very last changes regard GUI layout. We need a diferent LayoutManager to accomodate the two displays as well as the slider in our JFrame. This is done with the following lines.displays[0].addReference(wLineDataRef, wLineMaps);
JFrame jframe = new JFrame("VisAD Tutorial example 6_07");
jframe.getContentPane().setLayout(new BorderLayout());
JPanel dispPanel = new JPanel( new GridLayout(1,2) );

dispPanel.add(displays[0].getComponent());
dispPanel.add(displays[1].getComponent());

jframe.getContentPane().add(dispPanel, BorderLayout.CENTER);
jframe.getContentPane().add(latSlider, BorderLayout.SOUTH);


// Set window size and make it visible

jframe.setSize(600, 300);
jframe.setVisible(true);
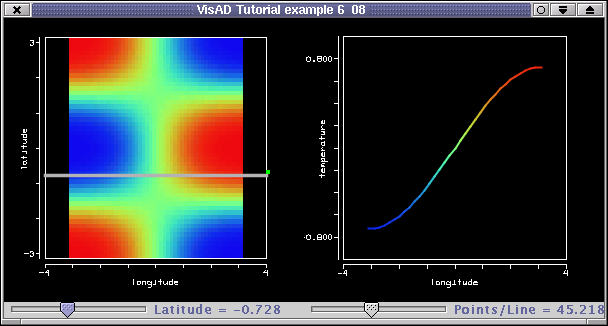
You can see the complete code here. If you run it with "java tutorial.s6.P6_07" and you'll see a window like the picture below.
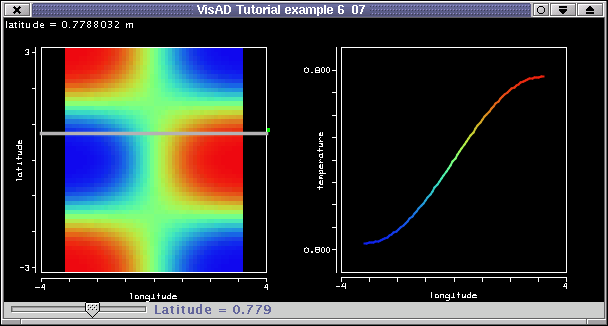
This example follows the pattern of the last few examples. The real difference is in thetemperature line on the right display. It is in fact a line, just like we had promised. The other little but nice difference is the addition of the slider. The slider provides an alternative way of moving the cursor and, therefore, the white line With the slider youcan also see at which northing value the white line is in.
The encourage to use other sets Util.isApproximatelyEqual( nPoints.getValue(), ((Real) nPointsRef.getData()).getValue(), 2 ) add slider ConstantMap[] tLineMaps = { new ConstantMap( 2.0f, Display.LineWidth ) };
You can get the code here. If you run it with "java tutorial.s6.P6_08" and you'll see a window like the picture below.
Being a 3D application means that main difference to the previous example is the domain
created from three RealTypes. The 3D data (the one that will be resampled) is now a cube, available as a separate data class, Cube.java. The cube is a wrapper for a FlatField, whose domain set is a Linear3DSet, and whose range is temperature. (The domain type of the cube has been chosen so as to match that of the current example, the domain3D.) The VisAD data object is extracted from a Cube object by calling aCube.getData(). In the current example, the cube is created and linked to its data reference with the following calls:domain3D = new RealTupleType(easting, northing, altitude);
As said, the cube will be sliced by a grey plane, created by the following function from a initial altitude value and with a certain number of points:Cube cube = new Cube(); cubeFF = (FlatField) cube.getData(); cubeDataRef = new DataReferenceImpl("cubeDataRef"); cubeDataRef.setData(cubeFF);
The function makePlaneSet() creates a flat three-dimensional surface at a given altitude value. The function uses the constructor:greyPlane = (Set) makePlaneSet(initAltitude, numberOfPoints*numberOfPoints);
which is a 3D set with manifold dimension = 2, that is a surface in 3D. (Were it manifold dimension = 1 or manifold dimension = 3, it would be a line or a parallelpiped, respectively. Please consult the Javadocs, for further information.)Gridded3DSet( domain3D, domain2DSamples, ptsPerDim,ptsPerDim);
Please refer to the code for further details.Linear2DSet tempor2DSet = new Linear2DSet(domain2D, lowVal,hiVal,ptsPerDim,lowVal,hiVal,ptsPerDim); domain2DSamples[0] = tempor2DSet.getSamples(false)[0]; domain2DSamples[1] = tempor2DSet.getSamples(false)[1];
ConstantMap[] wLineMaps = {  new ConstantMap( 0.75f, Display.Red ),
                             new ConstantMap( 0.75f, Display.Green ),
                             new ConstantMap( 0.75f, Display.Blue ),
                             new ConstantMap( 0.75f, Display.Alpha ) };
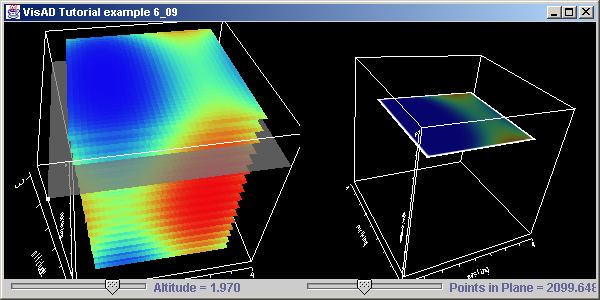
You can get the code here. If you run it with "java tutorial.s6.P6_09" and you'll see a window like the picture below. Moving the altitude slider will update the grey plane and the white cursor. Conversely, if you drag the white cursor with the right mouse button, the grey plane ad the alitude slider slider will by updated.
In the next example we shall add a few GUI elements, and add some more functionality to the this example, but without changing any of the VisAD data objects or its functions.
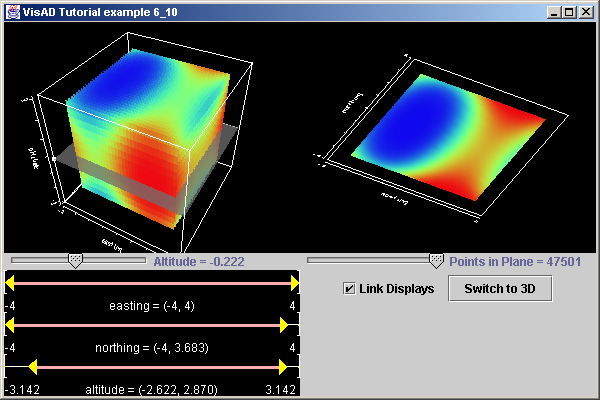
First thing you'll notice are the SelectRangeWidgets on the lower left hand side. For them to work, we need to create and add the following maps:
The widgets are created with the following function:rangeX = new ScalarMap(easting, Display.SelectRange ); rangeY = new ScalarMap(northing, Display.SelectRange ); rangeZ = new ScalarMap(altitude, Display.SelectRange ); // Add maps to display displays[0].addMap( rangeX ); displays[0].addMap( rangeY ); displays[0].addMap( rangeZ );
That is, all three widgets live inside a panel, which is added to the frame, like any ordinary Java GUI component. Note that the range sliders allow you to slice the cube out, replicating the functionality given by this slicer example, but with a fraction of the effort needed to implement the slice.private Component createRangeSliders(){ JPanel p = new JPanel(); p.setLayout(new BoxLayout(p,BoxLayout.Y_AXIS)); try { p.add( new SelectRangeWidget( rangeX ) ); p.add( new SelectRangeWidget( rangeY ) ); p.add( new SelectRangeWidget( rangeZ ) ); } catch (Exception ex) { ex.printStackTrace(); } return p; }
We then need to implement the displayChanged(DisplayEvent e) method of this interface. Before explaining how this is done in the example, we ought to remind you to register P_10 as the handler of DisplayEvents fired up by the cube display. In other words, you must add P_10 (the "this" object) as a listener of events generated by the cube display:public class P6_10 implements DisplayListener
(Remeber that displays[0] is the cube display.) If you forget this - and I often do - nothing of the code inside displayChanged() will happen. By the way, this is how displayChanged() is implemented:displays[0].addDisplayListener(this);
There are three important things to take notice in the method above: first, rotating and moving (including zooming in and out) is a DisplayEvent.FRAME_DONE event, so we only do something if the fired event is such; second, we have introduced a boolean variablepublic void displayChanged(DisplayEvent e) throws VisADException, RemoteException { if (e.getId() == DisplayEvent.FRAME_DONE) { if(displaysAreLinked){ displays[1].getProjectionControl().setMatrix(displays[0].getProjectionControl().getMatrix()); } } }
that gets turned on and off whenever the user clicks on the checkbox (See the createSyncCheck() method.); third, and this is where the action happens, we set the left display's projection matrix to be identical to that of the cube display. This is all done in the last statement.private boolean displaysAreLinked = true;
Vector scalarMaps = displays[1].getMapVector();
displays[1].clearMaps();
displays[1].removeAllReferences();
dispPanel.remove(displays[1].getComponent());
displays[1] = new DisplayImplJ3D("display1",new TwoDDisplayRendererJ3D());
displays[0].getProjectionControl().resetProjection();
You can get the code here. If you run it with "java tutorial.s6.P6_10" and you'll see a window like the picture below.
Well, this is fine for now, as far as interaction is concerned. Off course, we have just started to scratch the surface
of this topic in VisAD. But you might agree that the examples are getting too long, and there a need to avoid that.
Here we could profit from a better design...or a change of topic! We leave you to change the design, add more
features to your examples, and have fun.
In the next section we consider an altogether different topic: Text, Shapes and Vectors.