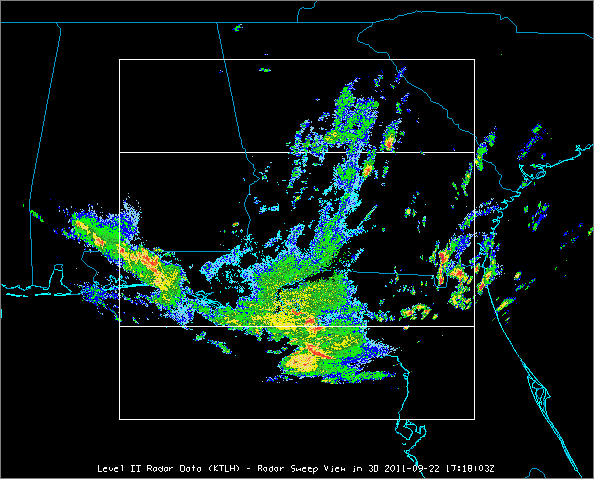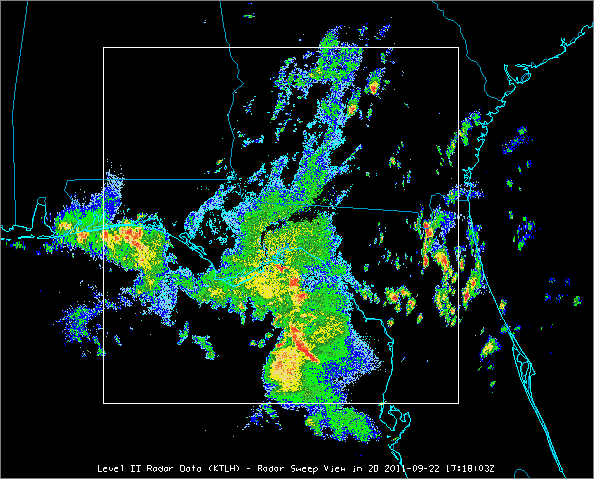
Image 1: Radar Sweep View in 2D Display
McIDAS-V can read and use WSR-88D Level II data, including reflectivity, radial velocity, and spectrum width, and display it in several ways.
The Radar Sweep View in 2D display appears in the Main Display window. The display depicts radar data at a variety of different elevation angles. For more information, see Radar Sweep View Controls.
The Radar Sweep View in 3D display appears in the Main Display window. The display depicts 3D radar data at a variety of different elevation angles. For more information, see Radar Sweep View Controls.
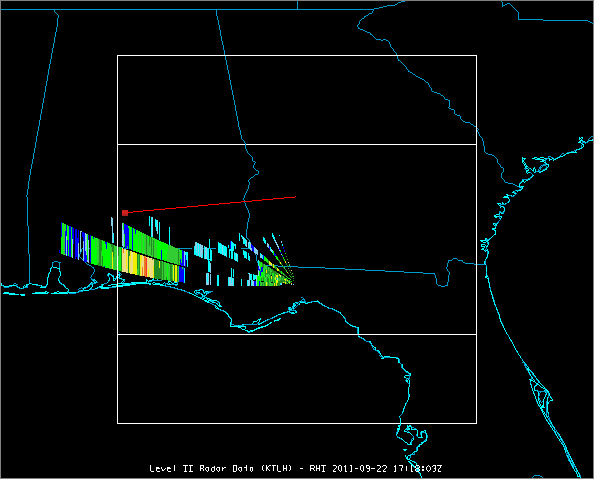
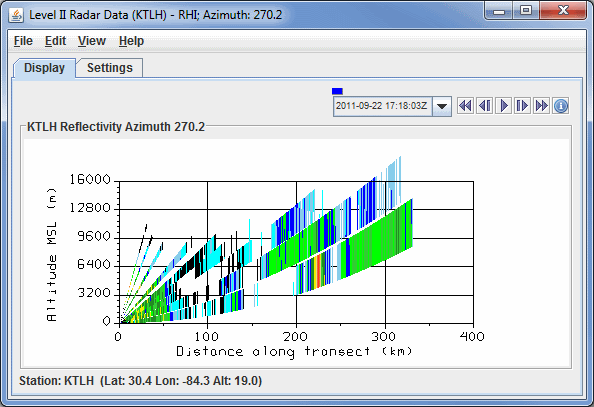
The RHI (Range-Height Indicator) display appears in the Main Display window and as a 2D plot in the Layer Controls tab. The display is a cross section of radar data, with one end point at the location of the radar and the other set by the user. In the chart, distance along transect is on the X-axis, and altitude is on the Y-axis. For more information, see Radar RHI Display Controls.
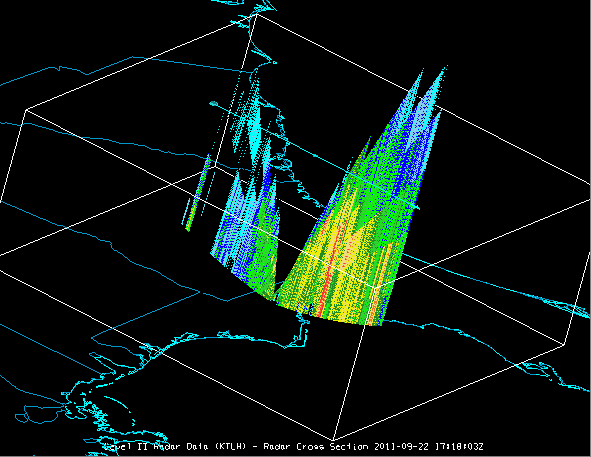
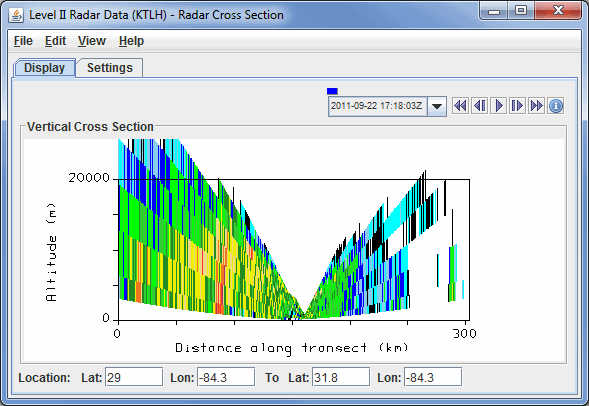
The Radar Cross Section display appears in the Main Display window and as a 2D plot in the Layer Controls tab. The display is a cross section of radar data, with distance along transect on the X-axis, and altitude in the Y-axis. For this display, you have the ability to change the position both end points of the transect line. For more information, see Radar Cross Section Controls.
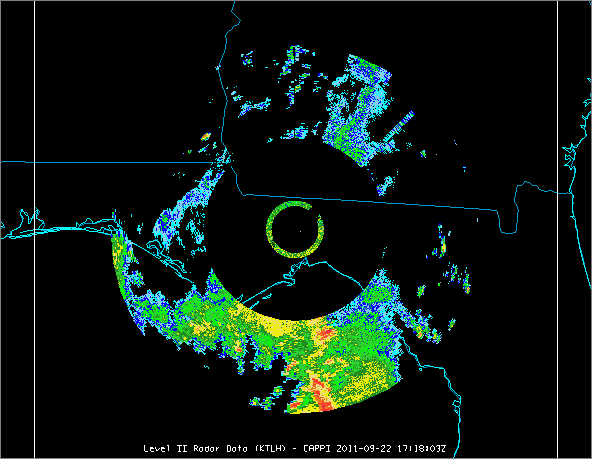
The CAPPI (Constant Altitude Plan Position Indicator) display appears in the Main Display window. The display depicts radar data at a constant altitude around the Radar site. For more information, see Radar CAPPI Display Controls.
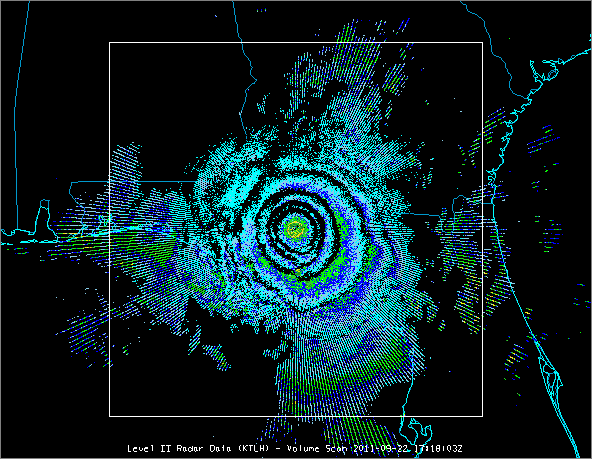
The Volume Scan Display appears in the Main Display window. This display depicts various elevation angles at once. For more information, see Radar Volume Scan Controls.
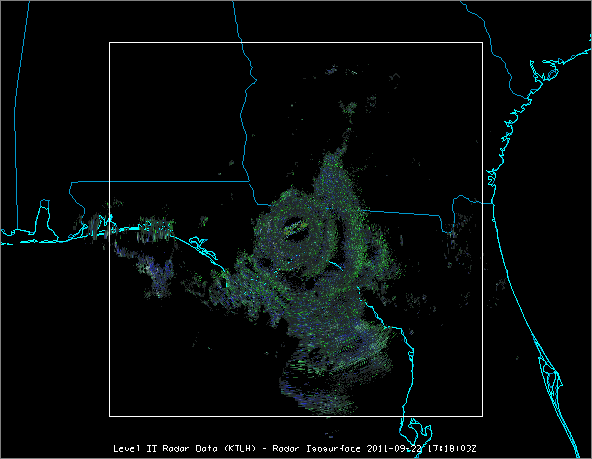
The Radar Isosurface display displays radar data at the user-specified reflectivity value. For more information, please see Radar Isosurface Controls.
For more information see Displaying Level II Radar Imagery.