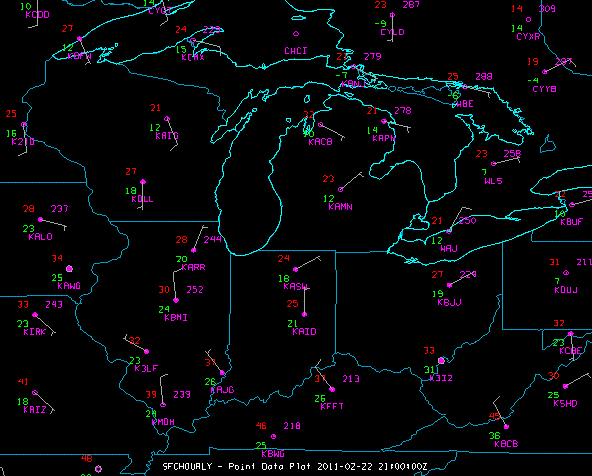
Image 1: Station Model Plot in the Main Display Window
This section describes how to make station model plots and contour displays using surface and upper air data. It also explains how to create and edit station models.
The steps include:
In the Data Explorer window, select the Data Sources tab. On the left side of this tab, select Point Observations->Plot/Contour from the list of available choosers. For more information about the Point Observations Plot/Contour chooser, see Choosing Point Data.
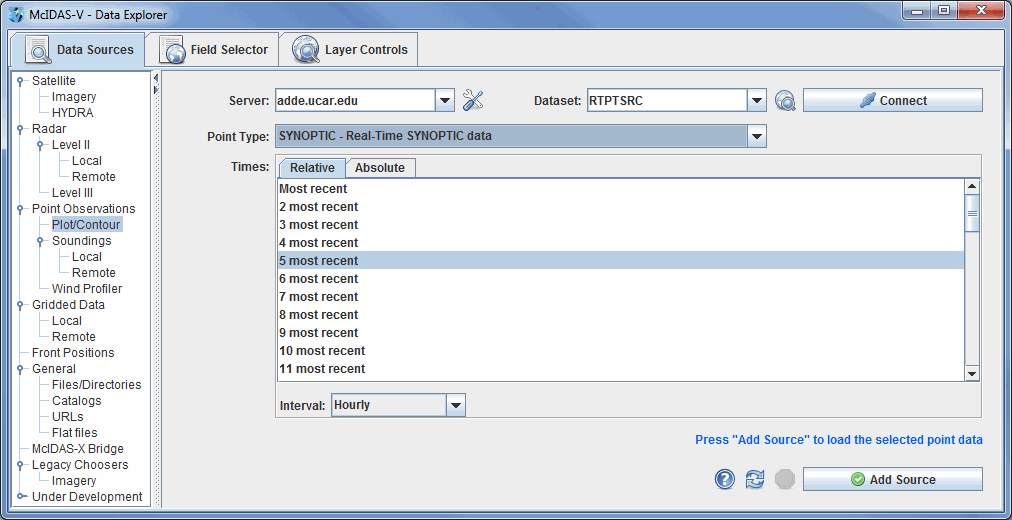
In the Server: and Dataset: entry boxes,
use the pulldown lists to select a local or remote server and a dataset with METAR data,
such as adde.ucar.edu and
RTPTSRC. You can also type a different server name into the
entry box. Click ![]() to find data on the remote server.
In the Point Type: selection
box choose "Real-Time SFC Hourly", or the equivalent depending on your data source. You can choose either the latest N times
using the Relative tab or select specific times using the Absolute tab. Click
to find data on the remote server.
In the Point Type: selection
box choose "Real-Time SFC Hourly", or the equivalent depending on your data source. You can choose either the latest N times
using the Relative tab or select specific times using the Absolute tab. Click ![]() when
you have made your selection. Only data from the current date will be retrieved from
the server.
when
you have made your selection. Only data from the current date will be retrieved from
the server.
The surface observation data will be shown in the Field Selector tab of the Data Explorer.
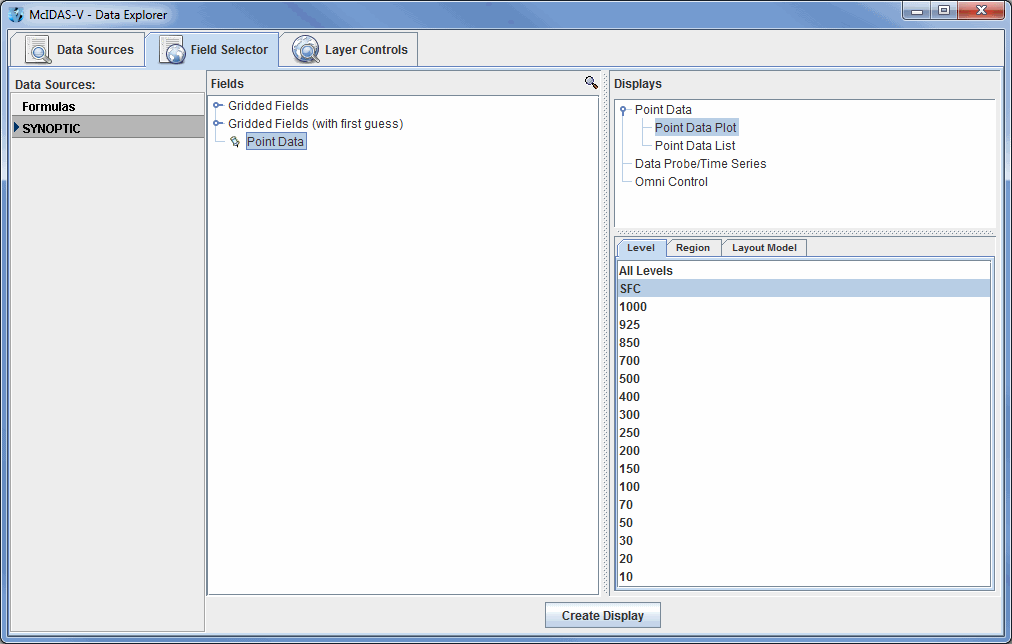
Select "Point Data" in the Fields panel and "Point Data Plot" under Point Data in the Displays panel. Make the display by clicking on the Create Display button at the bottom of the Field Selector tab.
To declutter the display, use the Point Data Plot Controls in the Layer Controls tab.
Upper air plots can be created the same way. In the Data Sources tab of the Data
Explorer, select a Point Type: of "Real-Time
Upper Air (Mandatory)," change the Interval to "12
hourly," and
add the source. In the Field
Selector, select a level of
500mb in the Level panel and click ![]() to plot your data in the Main Display window.
to plot your data in the Main Display window.
The Gridded Fields tree allows you to use the Barnes analysis to create gridded fields of specific point observation parameters.
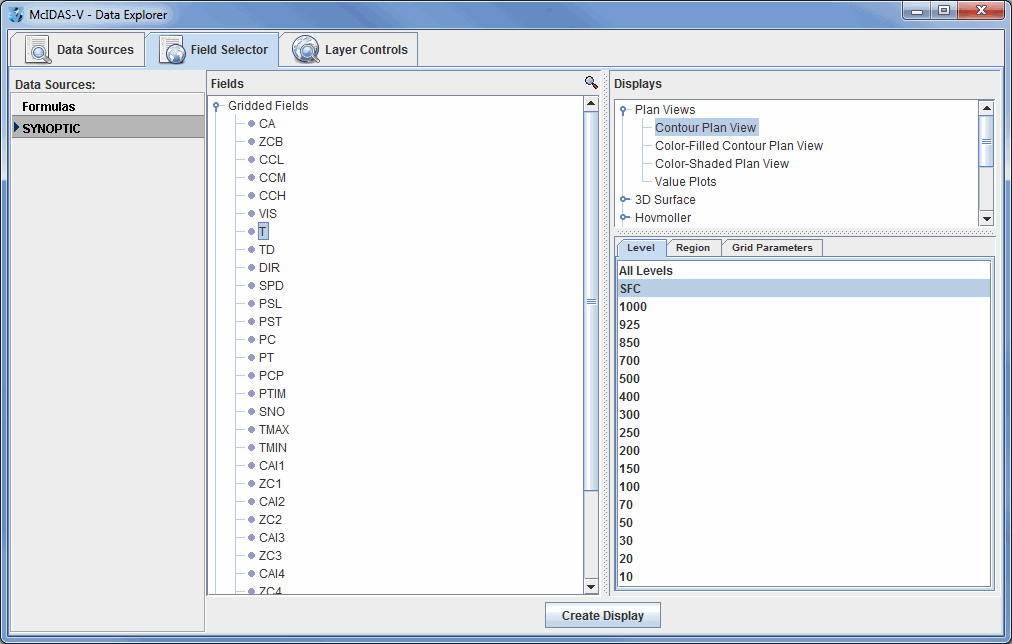
Select the SYNOPTIC (SFCHOURLY) dataset from the Data Sources panel of the Field Selector. In
the Fields panel, open the Gridded Fields tree by clicking on
the tab icon (![]() ) and
select the temperature (T) parameter. In the Displays panel,
select Contour Plan View, and create the display by clicking the
) and
select the temperature (T) parameter. In the Displays panel,
select Contour Plan View, and create the display by clicking the ![]() button
at the bottom of the Field
Selector tab. You can create or edit your own station models by using the Station Model Editor. To access the editor, click on the double down arrow (
button
at the bottom of the Field
Selector tab. You can create or edit your own station models by using the Station Model Editor. To access the editor, click on the double down arrow (![]() )
and select Edit under the Layout Model: section
in the Layer Controls tab
or select Tools->Station Model Template from
the Main Display window.
)
and select Edit under the Layout Model: section
in the Layer Controls tab
or select Tools->Station Model Template from
the Main Display window.
Upper air gridded fields can be created the same way. In the Field Selector, select the UPPERMAND dataset, open the Gridded Fields tab, select a parameter and level, and create the display.
For more help with displaying surface and upper air point data, please see the Point Observations tutorial on the McIDAS-V Documentation webpage.