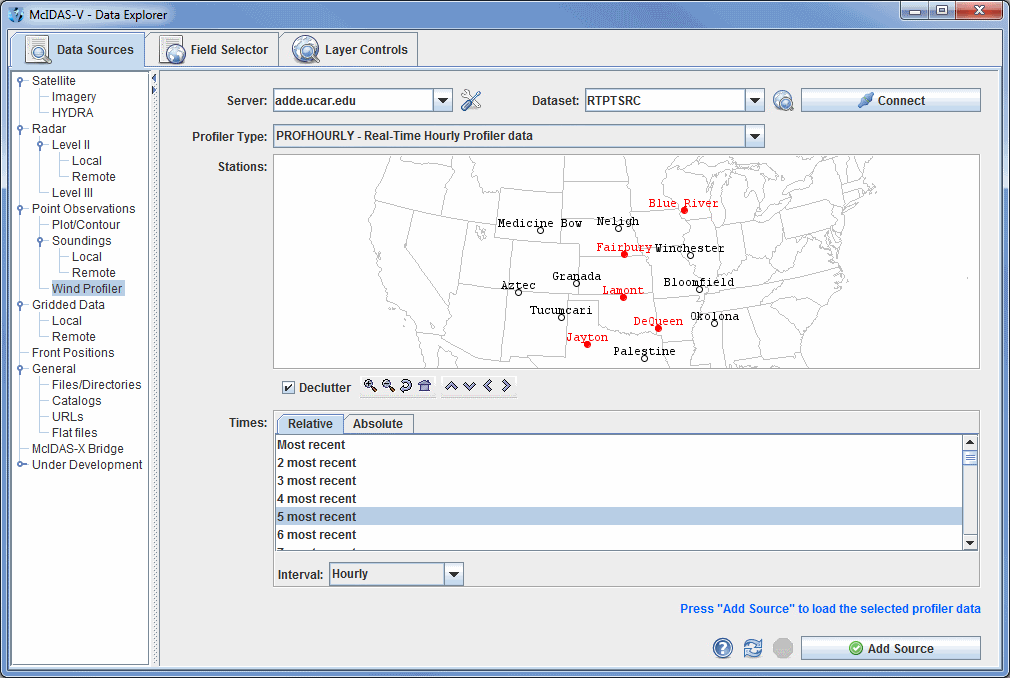
Image 1: Data Sources Tab of the Data Explorer
This section describes how to make plots from the NOAA National Profiler Network. The set of steps involve:
In the Data Explorer window, select the Data Sources tab. On the left side of this tab, select Point Observations->Wind Profiler. For more information about the wind profiler chooser, see Choosing NOAA National Profiler Network Data.
In the Server: and Dataset: entry boxes, use the pull down list to select a remote server and dataset with Profiler data, such as adde.ucar.edu and RTPTSRC. Connect to the server and select a profiler type such as "Real-Time Hourly Profiler data".
Select a station by clicking on it on the map. Select a group of stations by dragging the mouse cursor while holding down the Shift key to make a rubber band box, or do Shift+click to select more than one station. The map shows Profiler station names. To see more stations check the Declutter box off. When unchecked, the Declutter check box allows you to show all stations, and when checked, only a limited number of stations that do not overlap each other will be seen. As you zoom in, more station will appear, and it may be necessary to zoom in to see all of the stations clearly separated. The icons below the map allow you to navigate the map.
Once you have selected one or more stations, select a relative or absolute set of times. For absolute times, check individual times on or off with Ctrl+click. Select multiple times with Shift+click.
In the Interval selection
box you can choose from Hourly, 30 minute, 12 minute, or 6 minute intervals
to determine what time step will be used for your data. Once you
have selected an interval, click the ![]() button.
button.
A label similar to "Profiler Hourly - 6 stations" appears in the Data sources panel in the Field Selector tab.
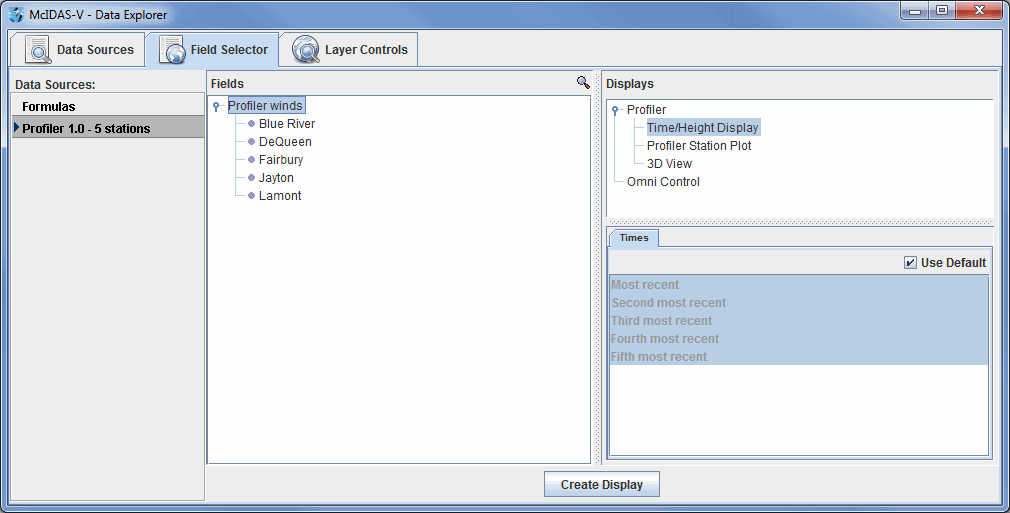
The Profiler winds item in the Fields panel allows you to make any of the Profiler displays for all the stations selected. You can use the individual station fields to make a display only for that station.
Select Profiler->Time/Height Display in the Displays panel to choose this type of display. Then make the display by clicking ![]() at the bottom of the Field Selector tab.
at the bottom of the Field Selector tab.
Similarly you can choose the Profiler Station Plot display (a mapped plan view of profiler winds at any single level above sea level), or the 3D View display which shows winds at all levels and at all stations selected.
For examples of the Profiler displays and how to control them, see Profiler Controls.
For more help with displaying profiler data, please see the Point Observations tutorial on the McIDAS-V Documentation webpage.