The Theta Surface display types are capable of working with gridded data containing a theta (potential temperature) component, as well as a scalar and/or vector components for different displays. The display types available are dependent on the derived field selected. The relevant derived fields and their respective display types are:
- Potential Temperature IsoSurface (from theta) - Creates a display of a potential temperature surface over a user-defined potential temperature value.
- Constant Theta Surface Height Plan View
- Contour Plan View
- Color-Filled Contour Plan View
- Color-Shaded Plan View
- Isentropic Topography
- Constant Theta Surface Height Plan View
- Potential Temperature IsoSurface Scalar Analysis (from theta) - Creates a display of a user-selected parameter over a user-defined potential temperature value/surface.
- 3D Theta Surface
- Contours Over Constant Theta Surface
- Color-Filled Contours Over Constant Theta Surface
- Color-Shaded Image Over Constant Theta Surface
- 3D Theta Surface
- Potential Temperature IsoSurface Vector Analysis (from theta) - Creates a display of vectors from user-selected parameters over a user-defined potential temperature value/surface.
- Constant Theta Surface Flow Displays
- Vectors Over Theta Surface
- Vectors Colored By Speed Over Theta Surface
- Constant Theta Surface Flow Displays
- Potential Temperature IsoSurface Advection (from theta) - Creates a display of advection of a user-selected parameter over a user-defined potential temperature value/surface.
- 3D Theta Surface
- Contours Over Constant Theta Surface
- Color-Filled Contours Over Constant Theta Surface
- Color-Shaded Image Over Constant Theta Surface
- 3D Theta Surface
The Grid 2D Trajectory or Grid 3D Trajectory formulas can be used to access these display types. The formulas will request for all of the fields to pass through it, including the u- and v-wind components, the vertical component, and a color-by component. An alternative to the formulas is utilizing the derived 2D and 3D fields of the data, Grid 2D Trajectory and Grid 3D Trajectory. When using these fields, all the user needs to specify is the scalar quantity when using the Trajectory Colored by Another Parameter display type, and McIDAS-V will pull out the relevant u- and v-wind components (as well as the vertical component when creating 3D Trajectories).
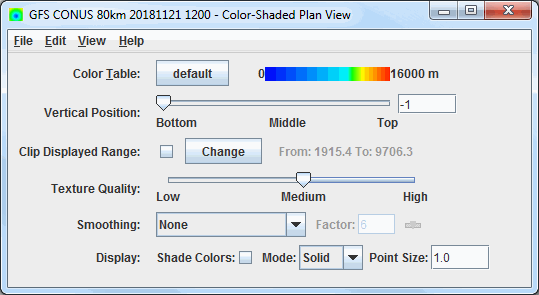
After selecting the "Potential Temperature IsoSurface (from theta)" derived field, clicking Create Display, and specifying the potential temperature value, the Layer Controls tab of the Data Explorer will appear, where various properties of the display can be set. Note that different Constant Theta Surface Height Plan View display types may have different controls:

Image 1: Constant Theta Surface Height Plan View Controls
- Contour - Opens the Contour Properties Editor to change how the contours appear in the Main Display window. This is an option for the Contour Plan View and Color-Filled Contour Plan View display types.
- Color Table - Shows the active color table and the associated high and low data values in the units of the display. As the mouse pointer is moved over the color bar, the value at a particular color is shown. Right click on the color bar or click on the button that displays the name of the Color Table to make modifications to the color bar. This allows for opening the Color Table Editor, changing the range, selecting other color tables, etc.
- Vertical Position - Changes the vertical position of the features with respect to other variables being displayed in the Main Display window. This can be changed with the slider, or by entering a value in the field and pressing Enter.
- Texture Quality - Sets the quality of the displayed texture. A higher quality will take longer to render and user more memory. This is an option for the Color-Shaded Plan View display type.
- Smoothing - Smooths the grid. There are seven types of smoothing: None, 5-point, 9-point, Gaussian Weighted, Cressman Weighted, Circular Aperture, and Rectangular Aperture. The amount of smoothness can be set for all except the 5 and 9-point smoothers. The higher the amount, the smoother the grid. For the Cressman, Circular and Rectangular aperture smoothing types, the smoothing factor is the radius in grid spacing units.
- Shade Colors - Colors every pixel to give a smooth gradation of color. The alternative is coloring an area of pixels corresponding to a single data grid cell with one color. This is an option for the Color-Shaded Plan View and Isentropic Topography display types.
- Mode - Sets the way the texture is displayed. The options are Solid, Mesh, or Points. This is useful for looking at the structure of the underlying data. This is an option for the Color-Shaded Plan View and Isentropic Topography display types.
- Point Size - Sets the size of the points when the Points Mode is selected. This is an option for the Color-Shaded Plan View and Isentropic Topography display types.
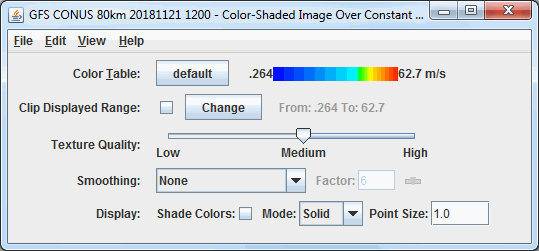
After selecting the "Potential Temperature IsoSurface Scalar Analysis (from theta)" or "Potential Temperature IsoSurface Advection (from theta)" derived field, clicking Create Display, and specifying the potential temperature value and vector parameter to plot, the Layer Controls tab of the Data Explorer will appear, where various properties of the display can be set. Note that different 3D Theta Surface display types may have different controls:

Image 2: 3D Theta Surface Controls
- Color Table - Shows the active color table and the associated high and low data values in the units of the display. As the mouse pointer is moved over the color bar, the value at a particular color is shown. Right click on the color bar or click on the button that displays the name of the Color Table to make modifications to the color bar. This allows for opening the Color Table Editor, changing the range, selecting other color tables, etc.
- Texture Quality - Sets the quality of the displayed texture. A higher quality will take longer to render and user more memory. This is an option for the Color-Shaded Image Over Constant Theta Surface display type
- Smoothing - Smooths the grid. There are seven types of smoothing: None, 5-point, 9-point, Gaussian Weighted, Cressman Weighted, Circular Aperture, and Rectangular Aperture. The amount of smoothness can be set for all except the 5 and 9-point smoothers. The higher the amount, the smoother the grid. For the Cressman, Circular and Rectangular aperture smoothing types, the smoothing factor is the radius in grid spacing units.
- Shade Colors - Colors every pixel to give a smooth gradation of color. The alternative is coloring an area of pixels corresponding to a single data grid cell with one color. This is an option for the Color-Shaded Image Over Constant Theta Surface display type.
- Mode - Sets the way the texture is displayed. The options are Solid, Mesh, or Points. This is useful for looking at the structure of the underlying data. This is an option for the Color-Shaded Image Over Constant Theta Surface display type.
- Point Size - Sets the size of the points when the Points Mode is selected. This is an option for the Color-Shaded Image Over Constant Theta Surface display type.
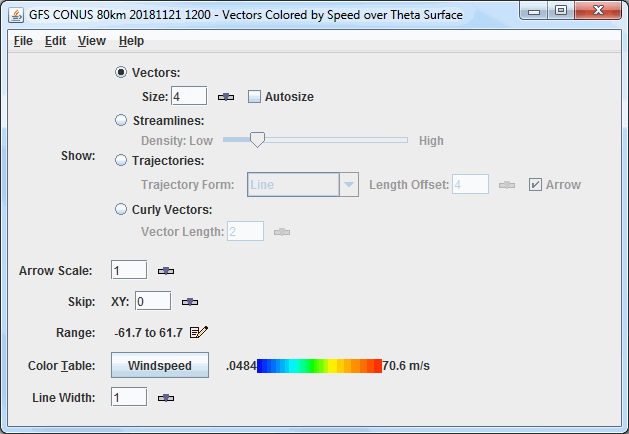
After selecting the "Potential Temperature IsoSurface Vector Analysis (from theta)", clicking Create Display, and specifying the potential temperature value and vector parameter to plot, the Layer Controls tab of the Data Explorer will appear, where various properties of the display can be set. Note that different Constant Theta Surface Flow Displays display types may have different controls:

Image 3: Constant Theta Surface Flow Display Controls
- Show - Switches between displaying Vectors, Streamlines, Trajectories, and Curly Vectors. Note that in order to use Trajectories or Curly Vectors, at least four timesteps must be displayed, otherwise, these Show modes will be inactive.
- Vectors - Displays vectors in the Main Display window.
- Size - Changes the length of the vectors. The Size box is an editable box where the user can enter a new size and press Enter, or use the slider (
 ) to change the value.
 - Autosize - Controls the size of the vectors based on zoom level. If the checkbox is checked, the size of the vectors will change proportionally as the zoom level changes. When unchecked, the vectors will remain the same size regardless of zoom level.
- Size - Changes the length of the vectors. The Size box is an editable box where the user can enter a new size and press Enter, or use the slider (
- Streamlines - Displays streamlines in the Main Display window.
- Density - Changes the density of the streamlines on the display. More streamlines will be displayed as the slider is moved closer to 'High'.
- Trajectories - Displays trajectories in the Main Display window.
- Trajectory Form - Allows for selecting the type of trajectory used in the display. The options are Line, Cylinder, Ribbon, and Deform Ribbon.
- Length Offset - Sets the number of timesteps to include in each trajectory.
- Arrow - Adds an arrow head to the trajectories if the Line Trajectory Form is selected.
- Curly Vectors - Displays curly vectors in the Main Display window. This option draws vectors that include multiple timesteps.
- Vector Length - Sets the length, or number of timesteps included with each curly vector.
- Vectors - Displays vectors in the Main Display window.
- Arrow Scale - Sets the size of the arrows in the Main Display window for all of the Show modes.
- Skip - Defines the number of grid points that are skipped to mitigate cluttering in the display. A skip interval of 0 utilizes all grid points, 1 uses every other grid point, 2 uses every third grid point, etc. This value can be modified by typing a value into the text field and pressing Enter or by using the slider button.
- Range - Lists the current range of data for sizing the vectors. Click on the Edit (
 ) icon to change the range.
 - Color Table - Shows the active color table and the associated high and low data values in the units of the display. As the mouse pointer is moved over the color bar, the value at a particular color is shown. Right click on the color bar or click on the button that displays the name of the Color Table to make modifications to the color bar. This allows for opening the Color Table Editor, changing the range, selecting other color tables, etc. This is available with the "Vectors Colored by Speed over Theta Surface" display type. If using "Vectors Over Theta Surface", this will be a Color dropdown menu where a color can be selected for the vectors.
- Line Width - Sets the line width (thickness) in the display. Click on the
 or put in a value and hit enter to change the value.
Many of the menu items seen utilizing these displays are standard options that can be found in the Menus section of the Layer Controls page. However, there are a couple of options unique to these displays.
The Edit menu can have these unique options:
- Change Color Unit - Sets the unit to color the display by. This control is available for the 3D Theta Surface displays as well as Vectors Colored by Speed over Theta Surface.
- Import Drawing - Allows for importing a drawing file (*.xgrf) which draws a Trajectory Initial Area. Once the drawing has been imported,
 can be clicked and trajectories the will be drawn using this shape as the Trajectory Initial Area.
The View menu has these unique options for all display types:
- Use Grid Projection - Re-centers the display and resets the zoom level back to the display's initial settings without changing any other preferences that have been modified.
- Enable Adaptive Resolution (Under Development) - Turns adaptive resolution on or off for the layer. This menu item is only available if adaptive resolution is enabled in the User Preferences. Note that adaptive resolution is still under development.