


Science
Seasonal Change on Uranus
Uranus has an 84-year orbital period and a spin-axis tilt of 97 degrees from its orbit normal, so that its poles alternate between 42 years of sunlight and 42 years of darkness (Figure 1), providing the largest fractional seasonal forcing of any planet in our solar system. For comparison, the earth's spin axis tilt is only 23.5 degrees.
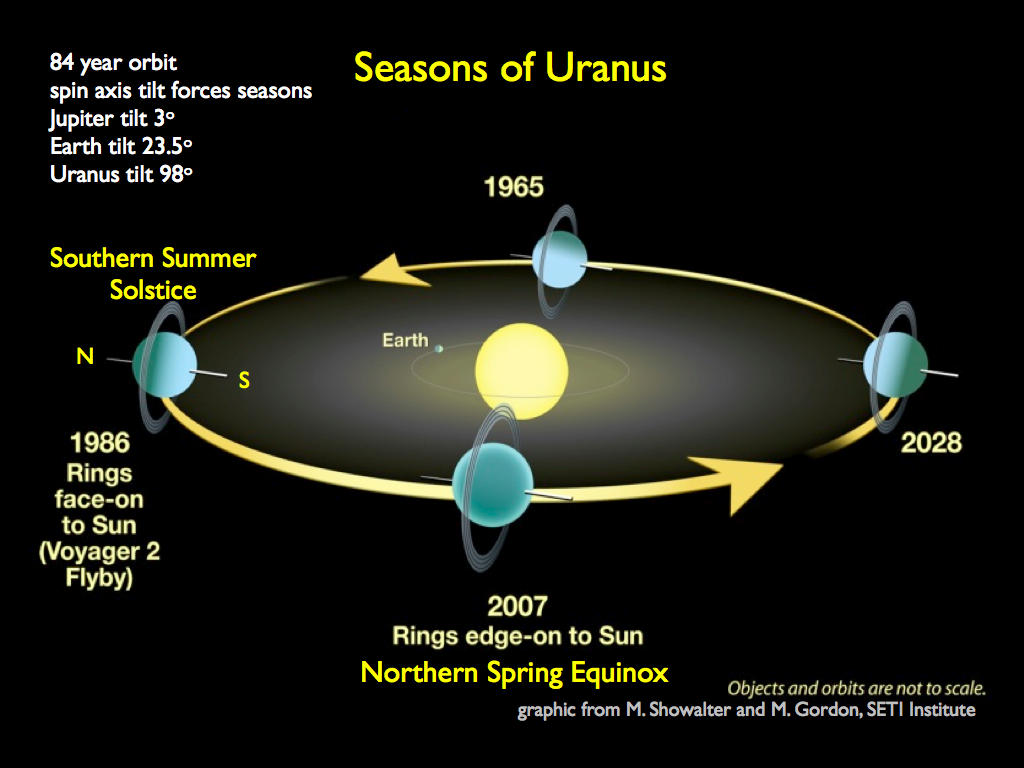
Figure 1. Click image for larger version.
Because of Uranus’ long radiative time constant, its response to that forcing should be delayed nearly a full season, so that it should have nearly maximum contrast between north and south hemispheres just before they reach equal illumination (at equinox). The contrast observed in 2007 is less than observed in the prior several years (Figure 2), and there appears to be a bright band forming in the northern hemisphere as the bright band in the southern hemisphere begins to decline slightly. This is consistent with our expectation that the hemispheric contrast should reach a maximum just before the approaching equinox (December 2007) and completely reverse by the next equinox. The imaging observations in this figure were obtained with NIRC-2 on Keck II, using the H filter. The Minnaert plot for latitudes between 45S and 48S (the southern band) and for the latitude band from 45N to 48N (the northern band) characterizes the brightness variations with viewing and illumination angles so that brightness changes can be corrected for these effects in comparing brightness observations at different times. The percentage changes are estimated at viewing and illumination angles of 45 degrees. The most robust result is the 43 percent increase in the reflectivity of the northern band that is beginning to form.
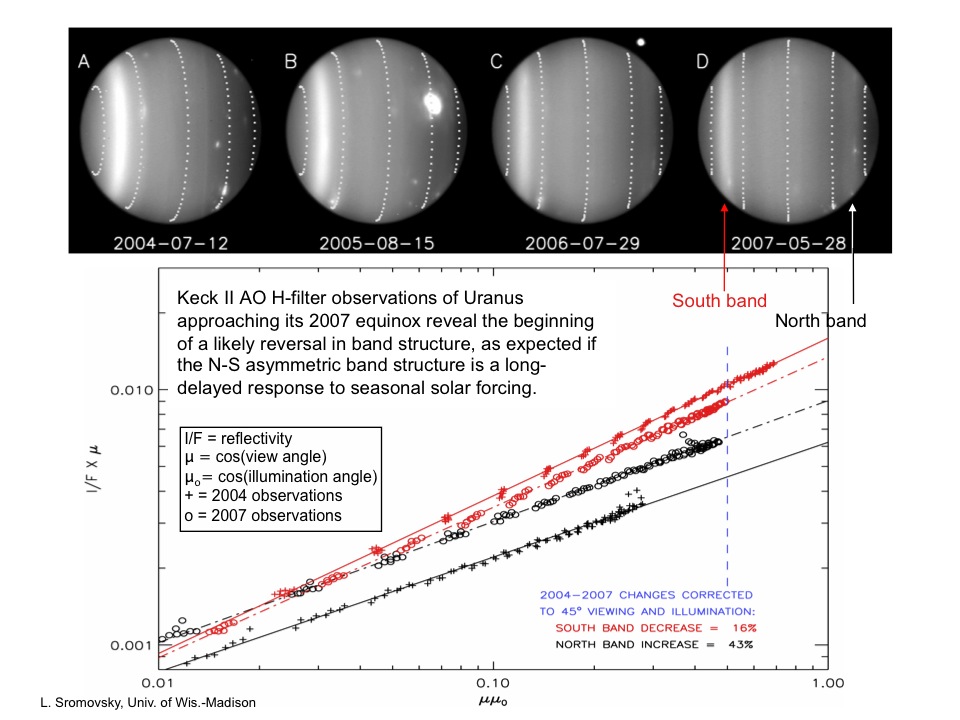
Figure 2. Click image for larger version.
The 2007 equinox of Uranus is our first opportunity to obtain nearly equal views of both hemispheres of the planet with modern telescopes and helps us to understand seasonal changes that might be occurring.
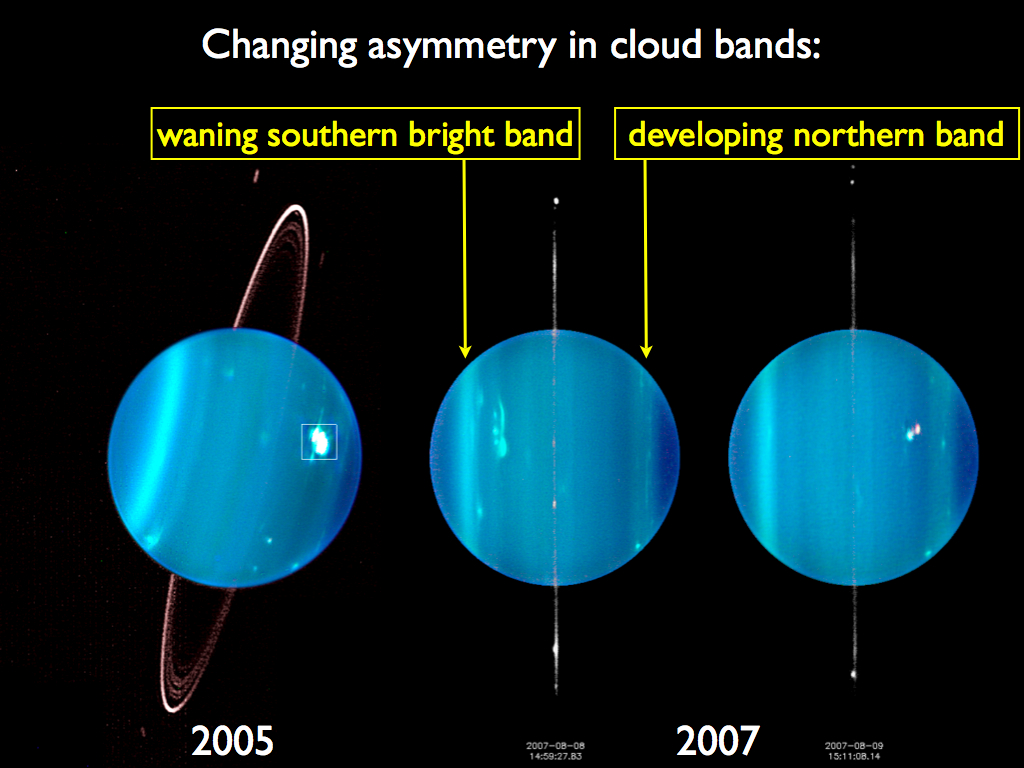
Figure 3. Click image for larger version.
The 30 July 2007 images in Figure 3 show the asymmetry in cloud bands, which are currently evolving. They also show both the "berg" at 25 S, just to the right of the brightest band on Uranus, which is ~45 S latitude (the South pole is to the left), and also, at 30 N, what is currently the brightest cloud feature on Uranus (that bright spot on the disk is not a satellite). Both of these cloud features have been drifting at fairly constant rates recently, making it possible for us to predict their locations in August from our observations in July. Both features have undergone recent changes in morphology and appear to be related to long lived storm systems we have seen in prior years, which had similar appearances and latitudes. These and less prominent bright cloud features are used to track the zonal winds on Uranus and to identify possible Rossby waves (which are seen in the Earth's weather patterns) and inertial oscillations (which are seen in Earth's oceans). Measurements of near infrared reflections of the cloud bands and discrete cloud features at different wavelengths will make it possible to determine the pressure levels of the cloud particles and their optical thickness. The less bright band in the northern hemisphere is expected to increase in brightness while the brighter band in the southern hemisphere is expected to decline as that hemisphere turns away from the sun.The composites are made using near-IR filters: J is assigned to blue, H to green, and K' to red. Because the planet is so much brighter than the ring in J and H filters, we used just the K' image to show the ring, but rendered it as grey because that is closer to its true color.
Dynamics of Uranus Cloud Features
A recent paper on Uranus cloud dynamics established with reasonable confidence, based on latitude range and morphological similarity, that the major multi-component cloud feature shown in Figure 4 likely existed since 1986 Voyager observations, during which it exhibited a nearly constant +\-2 degree oscillation in latitude with a period near 1000 days (Sromovsky and Fry 2005, Icarus 179 459-484). The black points and oscillation model plotted in the slide are from that paper. However, beginning in 2005, but only obvious in 2006 and 2007 observations (some from Sromovsky observing runs and some from the Hammel and de Pater observing runs), this regular behavior was revealed to be unstable. The feature began a steady drift towards the equator, portending a breakup, probably well before reaching it. Large changes in morphology of relatively short intervals also suggest a possibly violent dissipation. Also unusual is the increased vertical development in the more southerly component, which is indicated by its becoming visible in K’ images. This feature may well have an invisible circulation vortex underpinning it, and may be the missing link between two distinct types of vortices observed on Neptune. Some of Neptune’s northern dark spots stayed at fixed latitudes for long time periods, while the Neptune’s Great Dark Spot drifted towards Neptune’s equator and dissipated. The feature on Uranus suggests that it is possible for the same feature to exhibit both long term stability and also a later equatorial drift. The drifting of vortices towards the equator is expected on the basis of numerical model experiments (LeBeau and Dowling 1998, Icarus 132, 239-265); stable existence at a fixed latitude has not been explained.
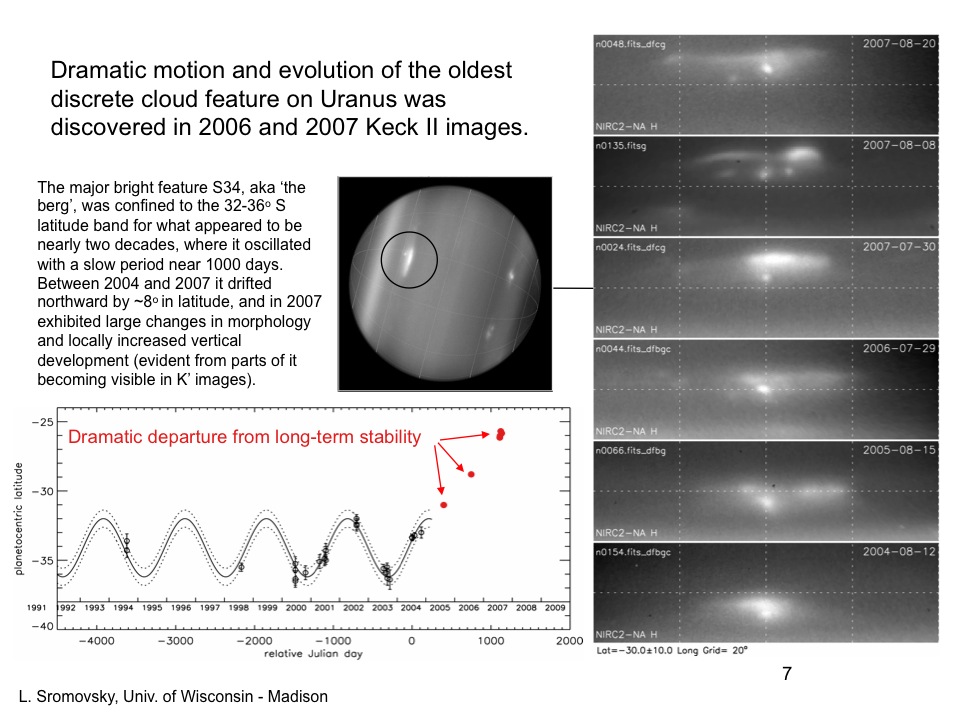
Figure 4. Click image for larger version.
The Brightest Cloud Feature on Uranus
In IAU Circular 8586, Lawrence A. Sromovsky and Patrick M. Fry of the University of Wisconsin Space Science and Engineering Center reported the brightest cloud feature ever observed on Uranus at near-infrared wavelengths, as shown in the included color composite figure. The full disk image in Figure 5 is enhanced to show background atmospheric structure, while the inset is enhanced to show the structure of the bright feature. The bright feature was imaged with the NIRC2 instrument and adaptive optics (AO) at the 10-m Keck II telescope on 14 August and15 August 2005, but is bright enough to have been observed without adaptive optics and without excellent seeing. In the K' band the cloud feature reflected nearly 17 percent of all the light reflected by Uranus. In K' AO images (resolution near 0.05 arcseconds), the peak brightness of the cloud was nearly fifty times the brightness of the background atmosphere, while it is seen to be up to 10 times brighter than the background in J and H bands. In a methane-band filter image covering 1.61-1.75 microns, about 7 percent of the light reflected from Uranus came from this single cloud feature. The previous record fractional cloud brightness of 5.5% using a higher contrast filter (1.68-1.78 microns), was obtained in 1999 for the first discrete cloud feature to appear in ground based digital images of Uranus (Sromovsky et al. 2000, Icarus 146, 307-311). The lifetime of the 1995 feature is probably of the order of a year: using its distinct morphology as an identifier, it was traced back to November 2004, was last seen in October 2005, and does not appear to be present in 2006 imaging. In the 1995 high-resolution composite image it is seen to be a complex of four parallel components extending over 8 degrees of latitude and 13 degrees of longitude. From reflectivity values in J, H, and K’ spectral bands we can estimate pressure level and effective fractional cloud coverage of the various components, which appear to have different colors in the composite inset. Fitting the two peaks in the upper scan requires cloud-top pressures of 500 and 550 mb and coverage fractions of about 10%, with the intermediate blue band (where K’ is at a local minimum) is best fit with a cloud near 700 mb. The width of these cloud elements is near 0.05 arcsec, and thus probably not resolved, implying that the actual cloud fractions could be much larger than 10%. The highest cloud is found in the lower scan, where the K’ I/F reaches a maximum, at which point the cloud-top pressure reaches 360 mb and an effective fractional coverage of 8%. Other sightings of this feature in Keck and HST images were used to track its motions and dynamical evolution, which are reported in a collaborative paper involving other observers, including Heidi Hammel, Imke de Pater, and Kathy Rages (Sromovsky et al. 2007, Icarus 192, 558-575).

Figure 5. Click image for larger version.
The First Uranus Dark Spot
Just as we neared the end of the 2006 hurricane season in the Atlantic Ocean, winds whirled and clouds churned 2 billion miles away in the atmosphere of Uranus, forming a dark vortex large enough to engulf two-thirds of the United States. Lawrence Sromovsky of the University of Wisconsin-Madison led a team that used NASA's Hubble Space Telescope to take the first definitive images of a dark spot on Uranus. The elongated feature measures 1,100 miles by 1,900 miles (1,700 kilometers by 3,000 kilometers).
There have been prior unconfirmed sightings of dark spots on Uranus, including sketches made in the early 1900s, low-contrast ultraviolet Voyager spacecraft flyby images in 1986, and near-infrared observations taken from a ground-based observatory in 1993. However, no other Hubble images taken almost every summer from 1994 through early 2006 have shown such a dark spot. This indicates that the current dark disturbance probably formed very recently.
Although rare on Uranus, dark spots have been frequently observed on Neptune. Uranus is similar in size and atmospheric composition to Neptune, but it has not appeared to have as active an atmosphere. Recently, however, Uranus's atmosphere has shown an increase in activity.
The dark spot was detected at a latitude of 27 degrees in Uranus's northern hemisphere, which is just now becoming fully exposed to sunlight after many years of being in shadow. Astronomers are keenly interested in how strongly and quickly the atmosphere of Uranus seems to be responding to seasonal sunlight changes.
This three-wavelength composite image was taken with Hubble's Advanced Camera for Surveys on August 23, 2006. The research team found the dark spot again on August 24. The inset image shows a magnified view of the spot with enhanced contrast. Uranus's north pole is near the 3 o'clock position in this image. The bright band in the southern hemisphere is at 45 degrees south.
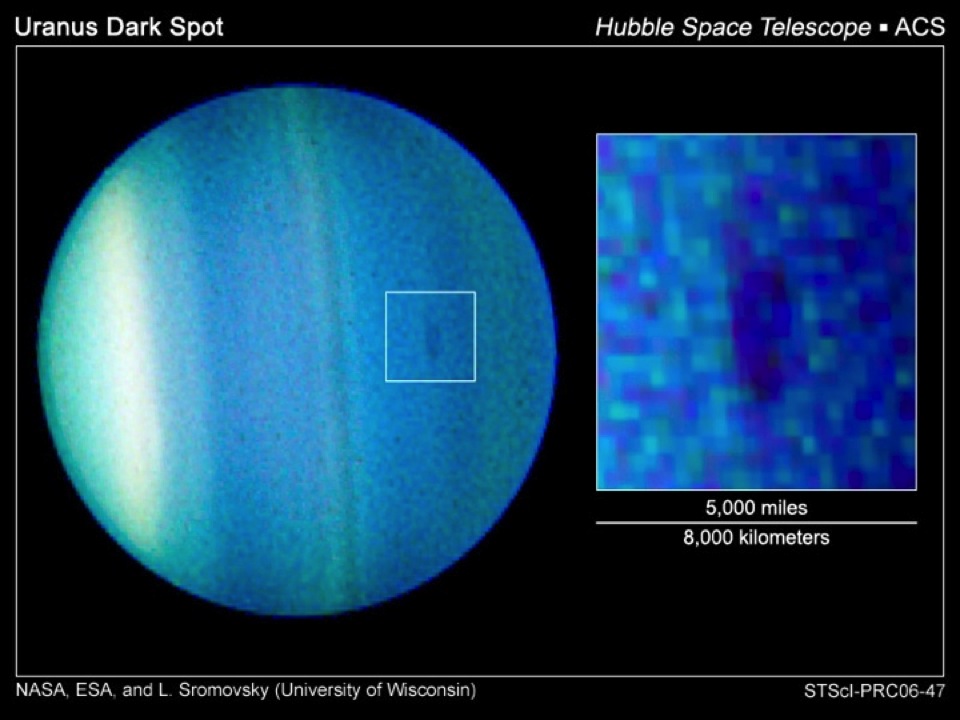
Figure 6. Click image for larger version.
Probing Uranus' Cloud Structure
The figures shown in Figure 7 are adapted from Sromovsky and Fry (2008, Icarus 193, 252-266), which displays observations from October 2006. The N-S scans along the slit direction are given at 1.240 microns (left), 1.248 microns (center), and 1.281 microns (right). For each wavelength the penetration depths are marked by vertical lines on the penetration depth spectra provided in the bottom row, and the reflectivity is marked on spectra for each of two latitude bands in the middle row, where the bands are indicated in the top row by colored cross hatching. Note the appearance of the bright band at 2-3 bars (middle column) and the strong N-S asymmetry that develops between 3 and 10 bars (right column). The image of Uranus has lines marking the slit boundary at the time the spectra were recorded. The penetration depths of these specta are controlled mainly by the absorption of methane, and to a much smaller degree by collision induced absorption of hydrogen. The pressure levels suggest that the deeper cloud might be composed of H2S (hydrogen sulfide) and the 2-bar cloud might be composed of NH4SH (ammonium hdrosulfide). The highest clouds observed on Uranus (P< 1bar, and mainly in the northern hemisphere) almost certainly contain a significant component of CH4 (methane).
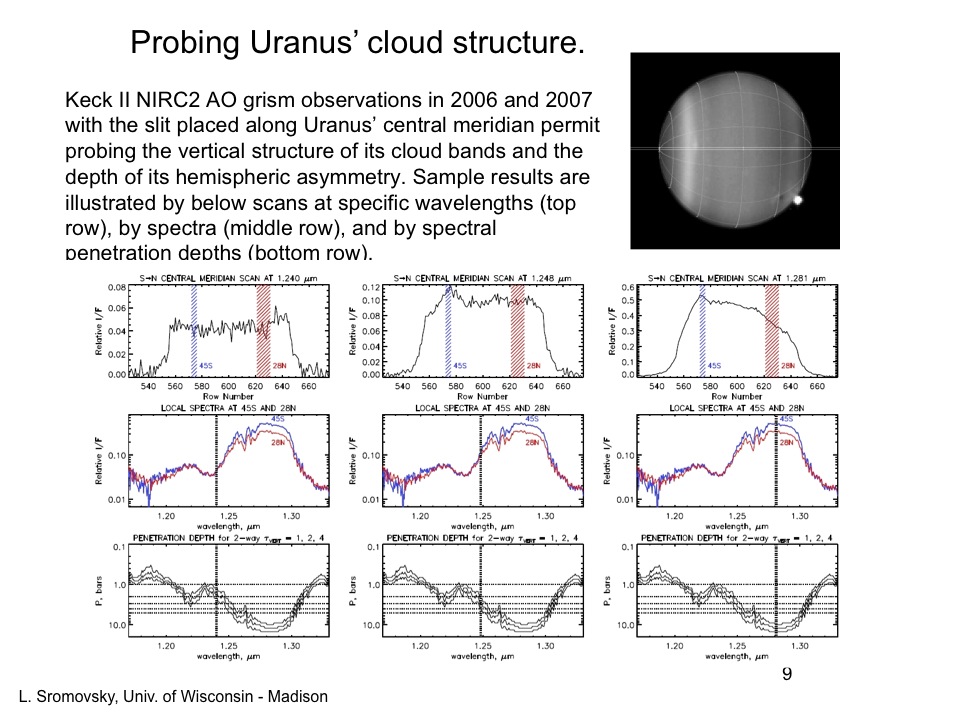
Figure 7. Click image for larger version.
The atmospheric circulation of Uranus
By tracking the motion of small and large discrete cloud features, we have been able to estimate the atmospheric circulation of Uranus, beginning with Voyager observations in 1986, which contained only 8 cloud features, and culminating with Keck observations in 1997-2007, containing several hundred features. The most accurate results were obtained from a coordinated multi-observer collaboration published in 2009 (Sromovsky et al. Icarus, in press), shown in Figure 8. The circulation is characterized by one prograde jet in each hemisphere, with maximum speeds of about 250 m/s (560 mph) and a retrograde jet at the equator. There is a small hemispheric asymmetry in the dependence of wind speed on latitutude, and it appears to be stable over decades. The mean meridional flow is too small to characterize, although long-lived features have exhibited both meridional oscillations and slow meridional drifts.
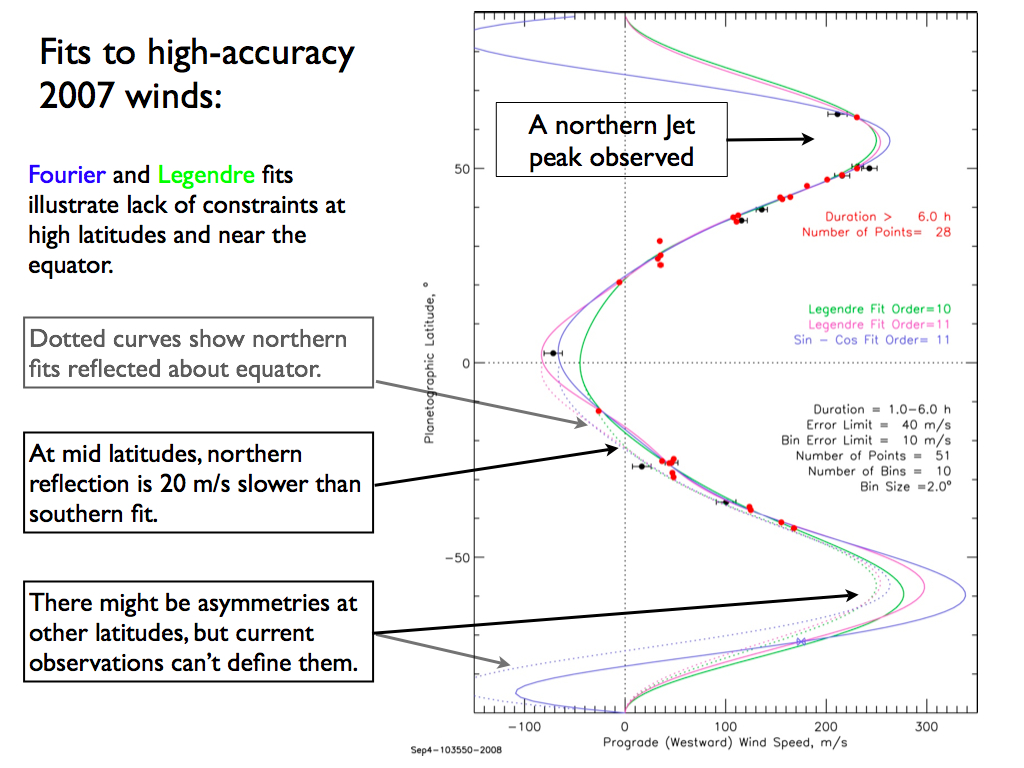
Figure 8. Click image for larger version.