9.6. Creating AMSR2 GAASP Product Reprojections
This example provides descriptions of product image creation from GCOM-W1 AMSR2 Algorithm Software Package (GAASP) Level 2 products.
9.6.1. Creating AMSR2 GAASP Level 2 Images
Find the options available for creating AMSR2 GAASP Level 2 GeoTIFFs:
polar2grid.sh -r amsr2_l2_gaasp -w geotiff -h
There are 7 CSPP GAASP Level 2 product files that are created from input AMSR2 Level 1 input files; 4 of those files contain arrays supported by Polar2Grid. The following list shows the Polar2Grid default output products associated with the given Level 2 GAASP NetCDF file:
File Prefix |
Product |
P2G Product Name |
|---|---|---|
AMSR2-OCEAN |
Sea Surface Temperature
Sea Surface Winds
Cloud Liquid Water
Total Precipitable Water
|
SST
WSPD
CLW
TPW
|
AMSR2-PRECIP |
Rain Rate |
Rain_Rate |
AMSR2-SNOW |
Snow Water Equivalent
Snow Cover
Snow Depth
|
SWE
Snow_Cover
Snow_Depth
|
AMSR2-SOIL |
Soil Moisture |
Soil_Moisture |
One command can be used to create all of the default products listed in the table above as long as all of the NetCDF product files are in the directory provided.
List the supported products that can be created from your GAASP Level 2 dataset:
polar2grid.sh -r amsr2_l2_gaasp -w geotiff --list-products -f <path_to_l1b_file>
To create AMSR2 GAASP GeoTIFF files of all default parameters, found in your data set and reprojected to the default Platte Carrée projection:
polar2grid.sh -r amsr2_l2_gaasp -w geotiff -f <path_to_l1b_file>
As an example, to create the default set of GeoTIFF images from the AMSR2 GAASP Level 2 product files acquired in Alaska on 29 January 2025, at 22:27 23:35 UTC, we would use the following command. Please note that we are using the polar_alaska Polar2Grid grid projection for this data:
polar2grid.sh -r amsr2_l2_gaasp -w geotiff -g polar_alaska -f *.nc
Executing this command produces these files in a Polar-stereographic Alaska centered projection:
gcom-w1_amsr2_CLW_20260129_222710_polar_alaska.tif
gcom-w1_amsr2_Rain_Rate_20260129_222710_polar_alaska.tif
gcom-w1_amsr2_Snow_Cover_20260129_222710_polar_alaska.tif
gcom-w1_amsr2_Snow_Depth_20260129_222710_polar_alaska.tif
gcom-w1_amsr2_Soil_Moisture_20260129_222710_polar_alaska.tif
gcom-w1_amsr2_SST_20260129_222710_polar_alaska.tif
gcom-w1_amsr2_SWE_20260129_222710_polar_alaska.tif
gcom-w1_amsr2_TPW_20260129_222710_polar_alaska.tif
gcom-w1_amsr2_WSPD_20260129_222710_polar_alaska.tif
Focusing on the Rain Rate GeoTIFF, it is created with a color enhancement already applied. Most, but not all supported Polar2Grid GAASP default parameters include pre-defined color enhancements.
We can add overlays to the GAASP Rain Rate GeoTIFF including a colortable using the add_coastlines.sh script.
add_coastlines.sh gcom-w1_amsr2_Rain_Rate_20260129_222710_polar_alaska.tif \
--add-colorbar --colorbar-text-color="black" \
--colorbar-title="AMSR2 GAASP Rain Rate (mm/hr)" \
--add-coastlines --coastlines-outline "black" \
--coastlines-level 1 --coastlines-resolution=i \
--add-borders --borders-level 2 --borders-outline "gray" \
--borders-width 1 --coastlines-width 2 --colorbar-height 125 \
--colorbar-text-size 100
The result is a PNG Rain Rate image shown below.

Fig. 9.22 CSPP AMSR2 GAASP Rain Rate PNG image with added borders, coastlines and an annotated colorbar in Polar Stereographic projection. The retrievals were created from January 29, 2026, 22:27 UTC observations collected over the US State of Alaska.
Similarly, we can create GeoTIFF images and add overlays to other AMSR2 GAASP Polar2Grid parameters as well. Using a dataset collected over Central America and surrounding waters on February 2,2026, the following commands are an example of the steps needed to create an Ocean Wind Speed parameter PNG. This product is dynamically scaled based upon the range of values in the given data.
polar2grid.sh -r amsr2_l2_gaasp -w geotiff -p WSPD -f AMSR2-OCEAN_v2r2_GW1_s202602020736030_e202602020746510_c202602020759490.nc

add_coastlines.sh gcom-w1_amsr2_WSPD_20260202_073603_wgs84_fit.tif \
--add-colorbar --colorbar-text-color="black" \
--colorbar-title="AMSR2 GAASP Surface Wind Speed (m/s)" \
--add-coastlines --coastlines-outline "black" \
--coastlines-level 1 --coastlines-resolution=i \
--add-borders --borders-level 2 --borders-outline "gray" \
--borders-width 1 --coastlines-width 2 --colorbar-height 125 \
--colorbar-text-size 100 --colorbar-tick-marks 2.5
The result is a PNG Ocean Wind Speed image shown below.
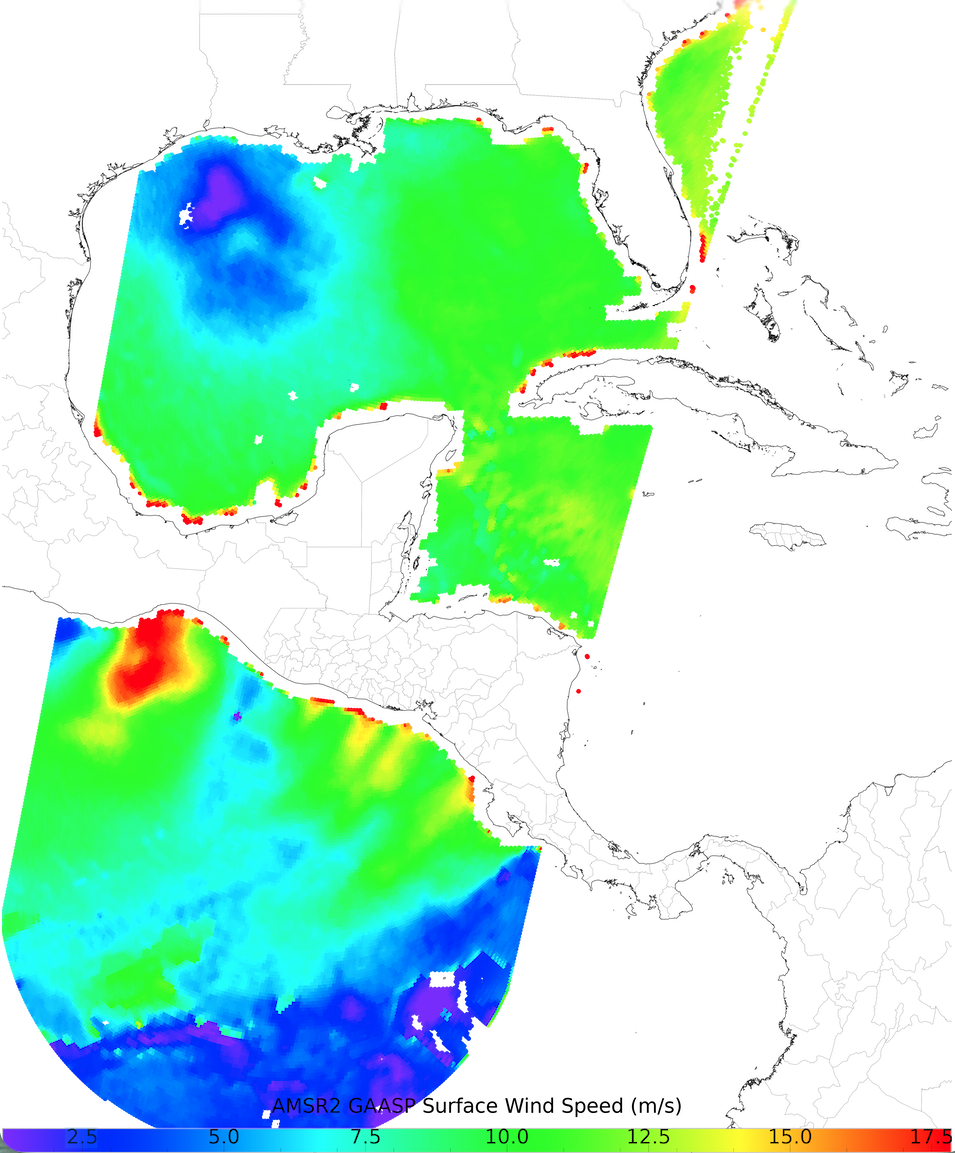
Fig. 9.23 CSPP AMSR2 GAASP Wind Speed PNG image with added borders, coastlines and an annotated colorbar. The retrievals were created from February 2, 2026, 07:36 UTC observations collected over Central America and surrounding waters.