
How do the cloud top products based on the constructed radiances compare with MODIS Collection 6 products?
Cloud Clearing
For background, there is an operational Aqua MODIS cloud mask that is provided in the MYD35 product. The MODIS cloud mask uses both solar and IR band tests. For VIIRS, a MODIS-VIIRS continuity cloud mask (called MVCM) is being used; it is basically the MODIS cloud mask but adopts only the spectral bands that are common to each imager. The absorption IR bands are most important at high latitudes where there are often temperature inversions, and also add information at nighttime and in high solar zenith angle scenes. This functionality is lost with VIIRS since there are no water vapor or other absorption bands. We can demonstrate that our constructed IR bands add functionality back to the VIIRS cloud mask, as shown in Fig. 1 for a complicated scene over Antartica (April 17, 2015 at 1855 UTC). A grayscale image shown in Fig. 1a, and the operational MYD35 product is shown in Fig. 1b. The colors are as follows: green means confidently clear; blue means probably clear; red means probably cloudy, white means confidently cloudy, and black means no result. The results in Fig. 1c are found with the MVCM, i.e., without any IR absorbing bands, and are clearly degraded from the MYD35 product. As shown in Fig. 1d, inclusion of the constructed IR bands and the cloud mask tests associated with those bands dramatically improves the cloud mask. A comparison between the MODIS product in Fig. 1b and the cloud mask obtained with the constructed IR bands (Fig. 1d) demonstrates that the cloud mask is not exactly the same as that in the MYD35 product, but much improved over what could be expected without the additional IR absorption band information.
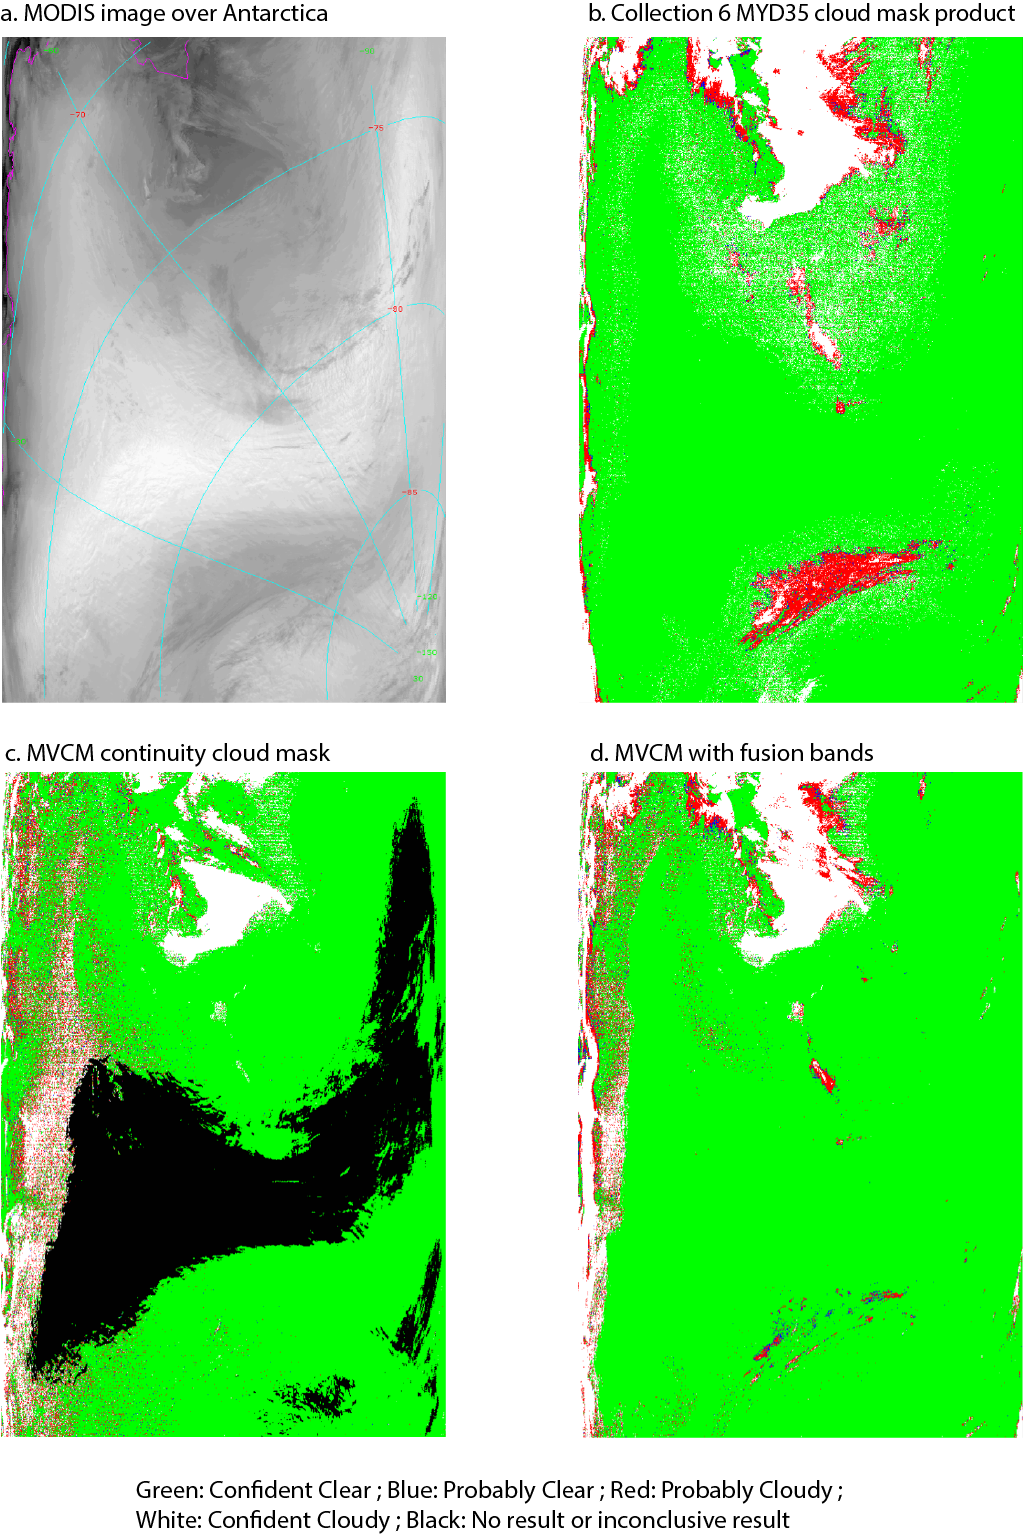
Figure 1: Application of constructed fusion radiances in cloud mask for MODIS scene over Antarctica on April 17, 2015 at 1855 UTC. (a) grayscale 11-µm image (b) cloud mask results from the MODIS Collection 6 MYD35 product. (c) cloud mask results from the MODIS-VIIRS Continuity cloud mask (MVCM) that uses subset of MODIS/VIIRS bands that are available on both sensors, and (d) MVCM results when fusion radiances are included, using same tests that are used for MODIS with no changes to thresholds or other tuning.
Cloud Top Pressure
Thanks to Rich Frey (SSEC, UW-Madison) for going to the trouble of taking a look at some results using the constructed IR absorption band radiances and comparing to MODIS Collection 6 results. Note that the 15-µm CO2 bands are used for mid-level and high-level clouds only. The IR window is used for low-level clouds. When looking at the results below, the clouds at pressures higher than about 700 hPa are generated using the IR window band.
Figure 2 shows cloud top pressure results for a MODIS granule on April 17, 2015 at 0430 UTC. The middle panel shows the MODIS Collection 6 product at 1-km resolution, while the right panel shows MODIS CTP obtained using the constructed bands, also at 1-km resolution. There are some minor differences in the results for the high clouds, but in general the results are quite similar between the official Collection 6 product and the results generated using the constructed IR bands. For this test, none of the logic in the software was changed, e.g., no thresholds changed. In other words, nothing was tuned to offer an advantage for the use of the constructed radiances. The only thing that changed was the substitution of the measured IR absorption band radiances (bands 33 through 36) with those constructed based on the MODIS-AIRS fusion method.
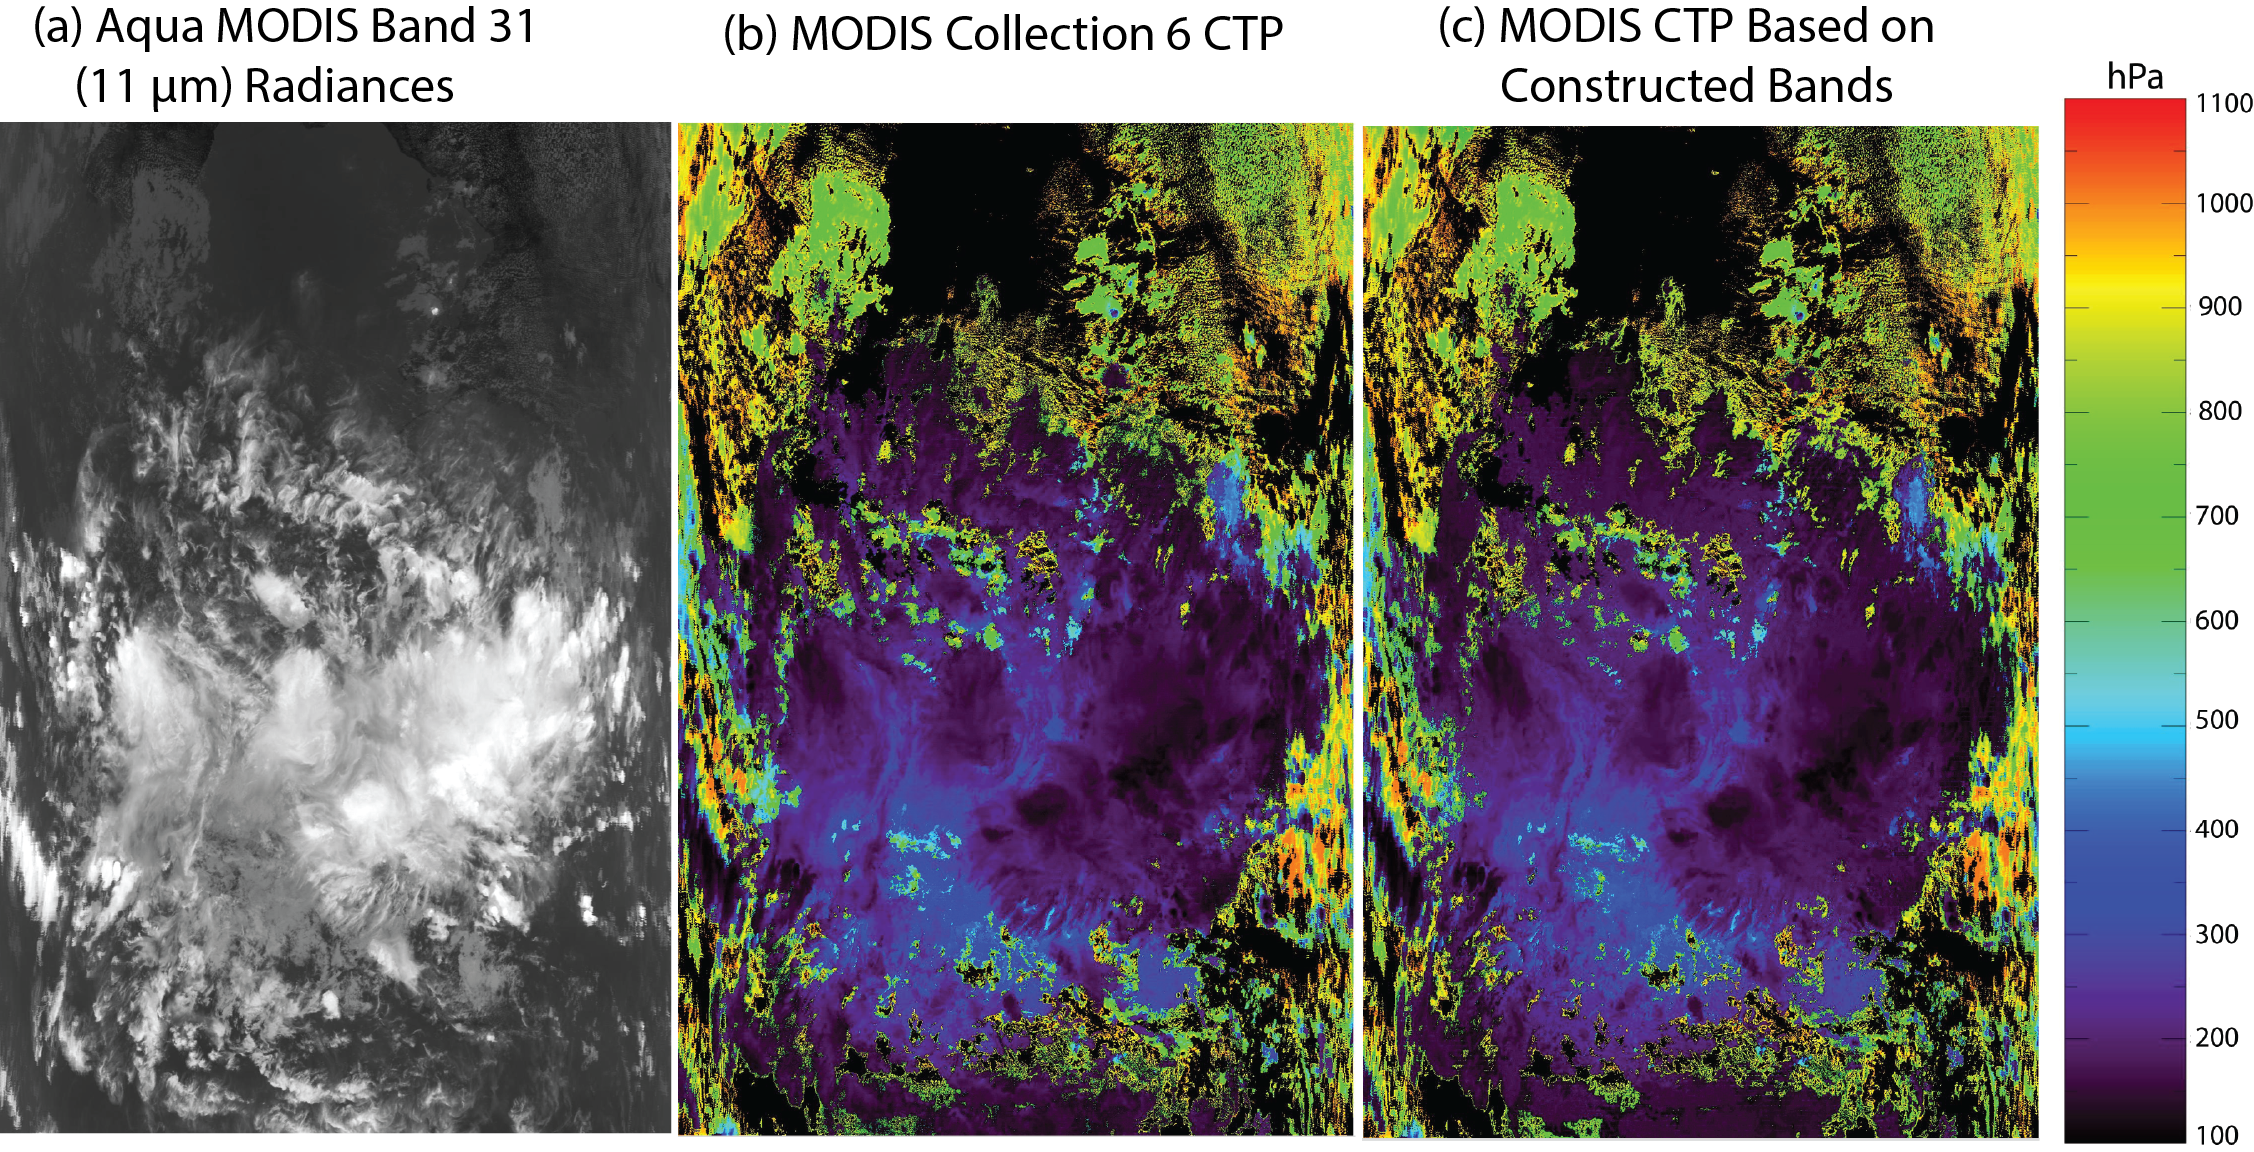
Figure 2: (a) Measured MODIS Band 31 (11-µm) radiances for April 17, 2015 at 0430 UTC. (b) MODIS Collection 6 cloud top pressure (hPa). (c) MODIS cloud top pressure obtained using the constructed radiance bands.
IR Cloud Phase
Figure 3 shows IR cloud phase results for a MODIS granule on April 17, 2015 at 0430 UTC. Note that the Collection 6 IR phase product is based on both IR band brightness temperature thresholds and also cloud emissivity ratios, which involve radiative transfer calculations (see Fig. 3 of Baum et al. 2012 describing the MODIS Collection 6 products). The middle panel shows the MODIS Collection 6 IR phase product at 1-km resolution, while the right panel shows MODIS IR phase obtained using the constructed bands, also at 1-km resolution. The results are almost identical. As with the CTP results, none of the logic in the software was changed, e.g., no thresholds changed in the cloud phase routine. In other words, nothing was tuned to offer an advantage for the use of the constructed radiances. The only thing that changed was the substitution of the measured IR absorption band radiances with those constructed based on the MODIS-AIRS fusion method.
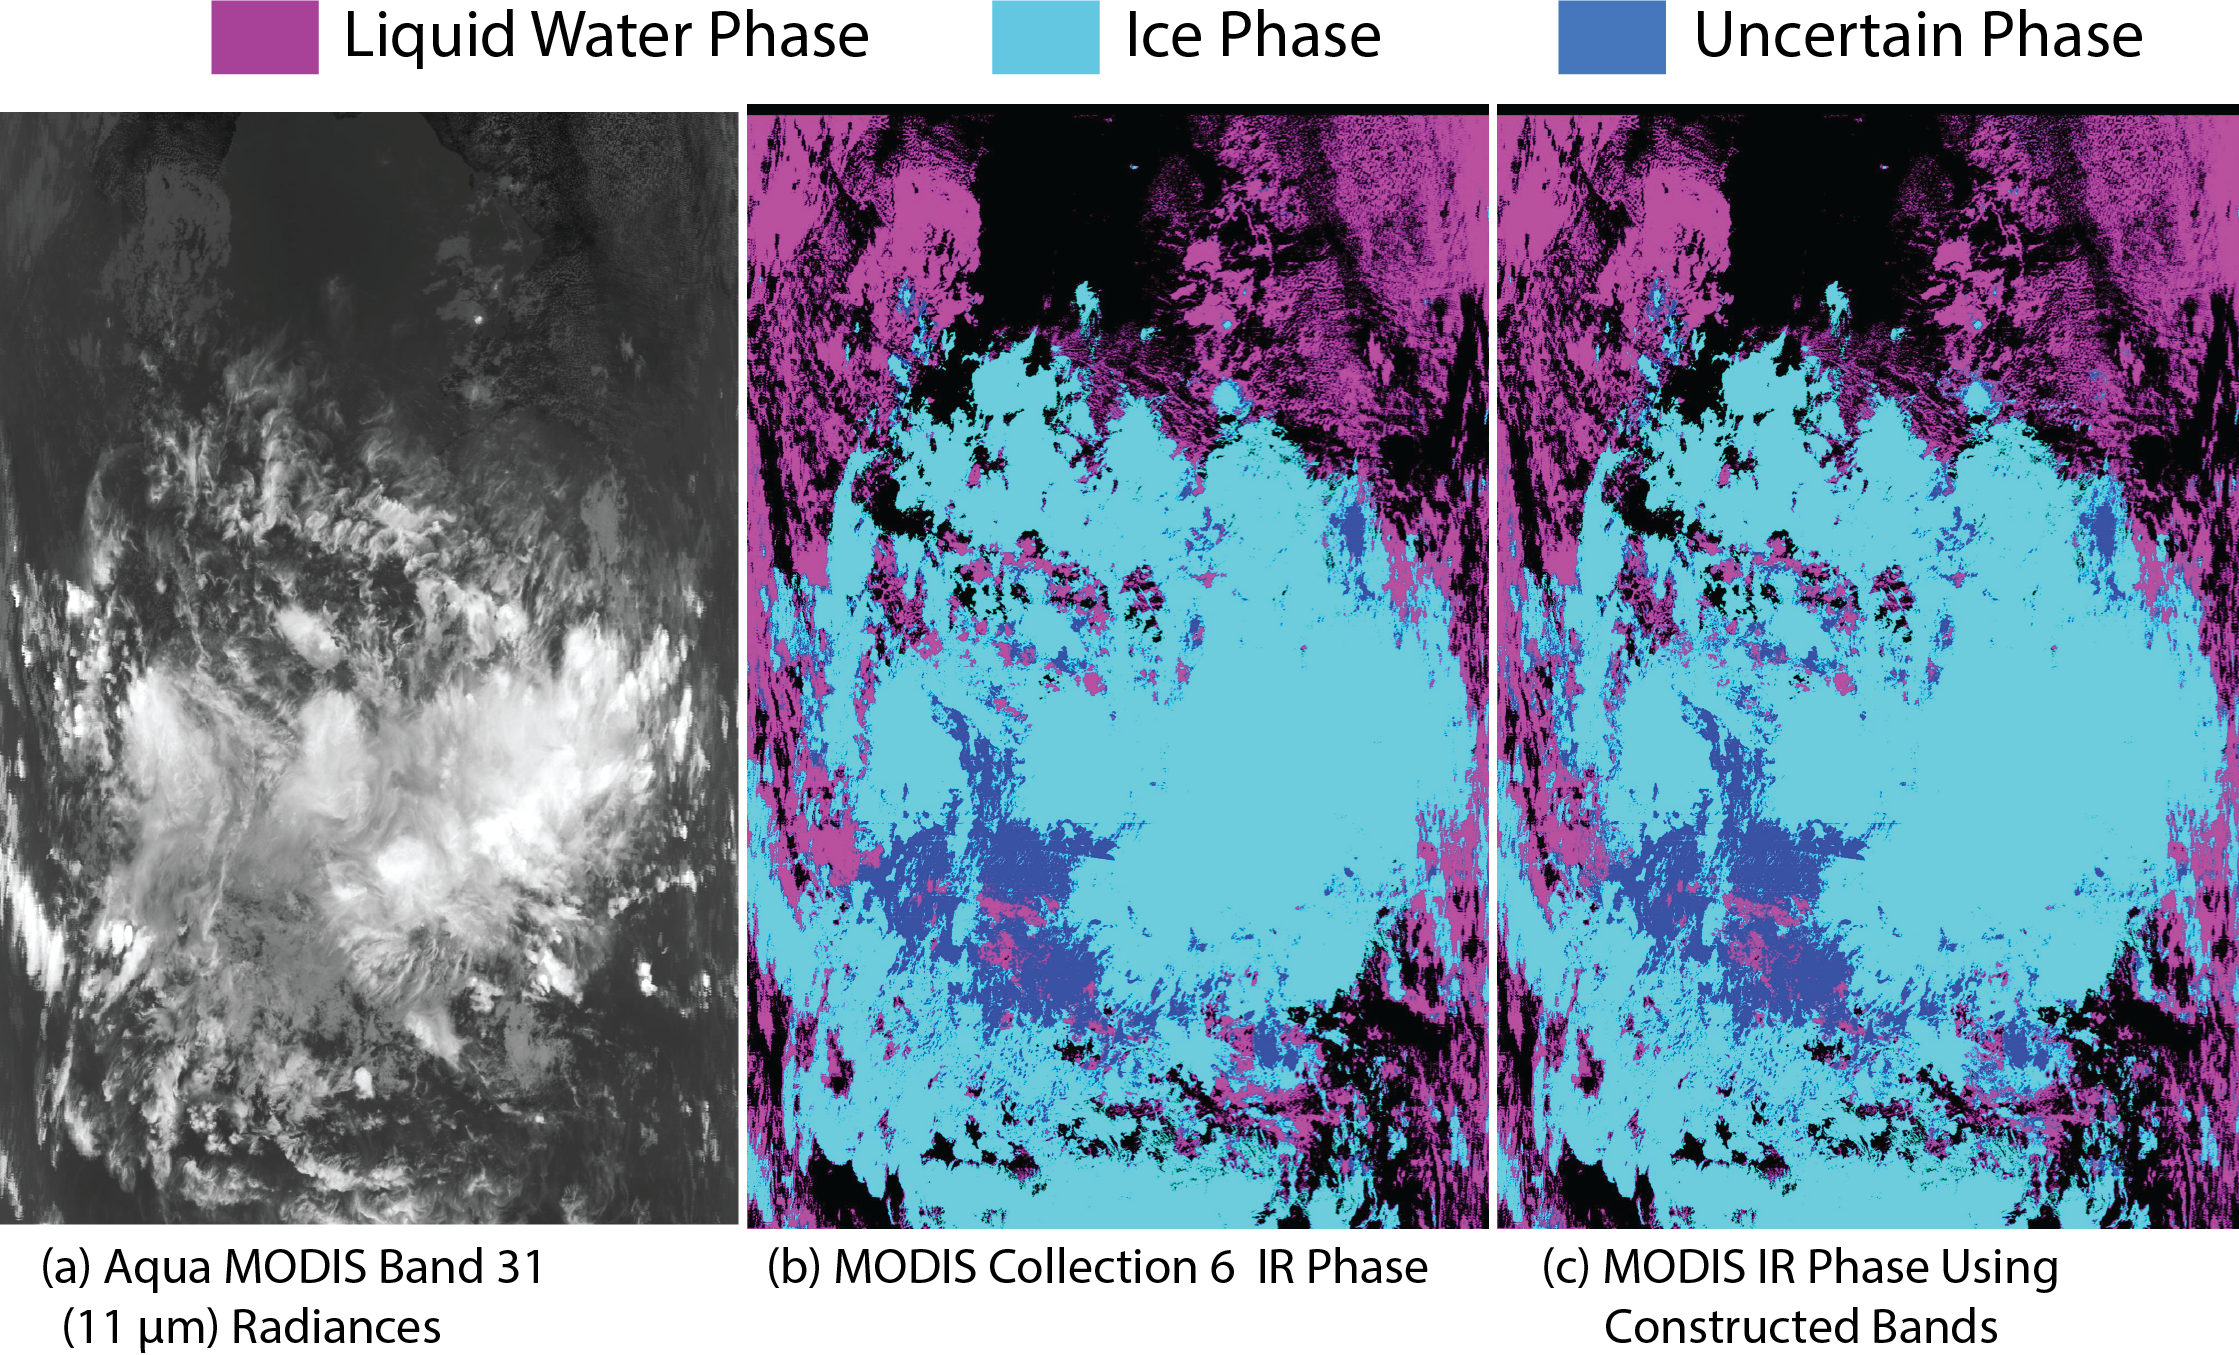
Figure 3: (a) Measured MODIS Band 31 (11-µm) radiances for April 17, 2015 at 0430 UTC; (b) MODIS Collection 6 IR cloud phase; and (c) MODIS IR cloud phase obtained using the constructed radiance bands.
While global testing is ongoing, preliminary results indicate that the use of the constructed IR absorption band radiances can be used to replicate the cloud mask, cloud top pressure and IR phase products without significant degradation.
The next step is to construct similar IR band radiances for VIIRS based upon VIIRS+CrIS data and see how the cloud properties based on these bands compare to those from Aqua MODIS.