M-AERI Software Overview
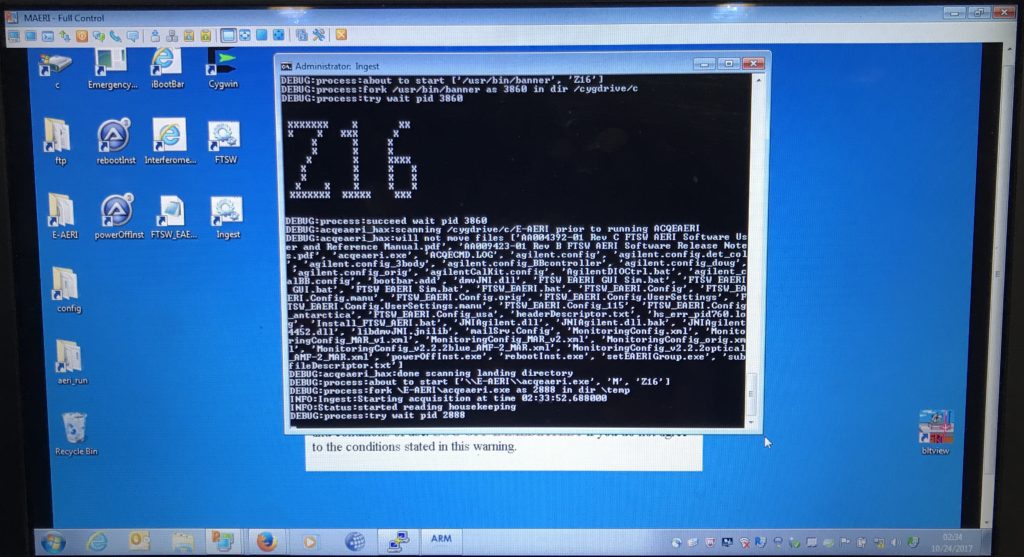
VM Desktop shotcuts
- iBootBar: remote controlled power supply for AERI & TEC
- cygwin: command line interface
- FTSW: manual control of AERI
- Ingest: automatic control of AERI and data collection
Ingest
- Black cygwin window
- Scrolls continuously and displays current scene (e.g. S42)
- Scan sequence is listed in table below
- Runs automatically at VM startup
- Cycles at 0000 UTC
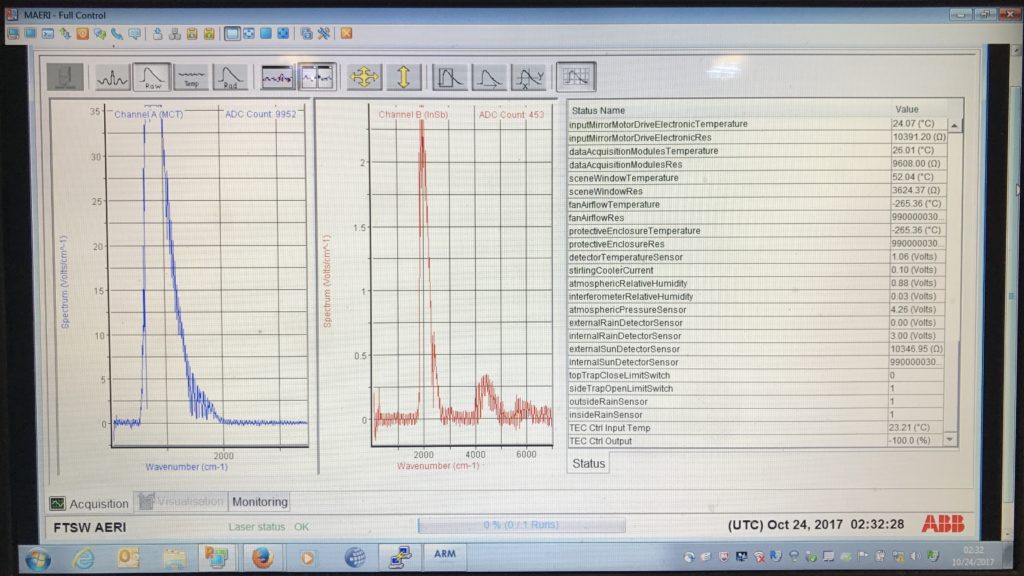
FTSW Acquisition tab
- Displays real-time data and housekeeping
- Two graphs on left display the raw radiance measurement for each detector
- MCT 600-1850 cm-1
- InSb 1850-3000 cm-1
- Status list shows housekeeping variables. Most refresh every 30 sec
- Useful values for rain sensors, TEC can be found at the bottom
- Some values display -265 °C (open circuit) because the sensor does not exist on the M-AERI
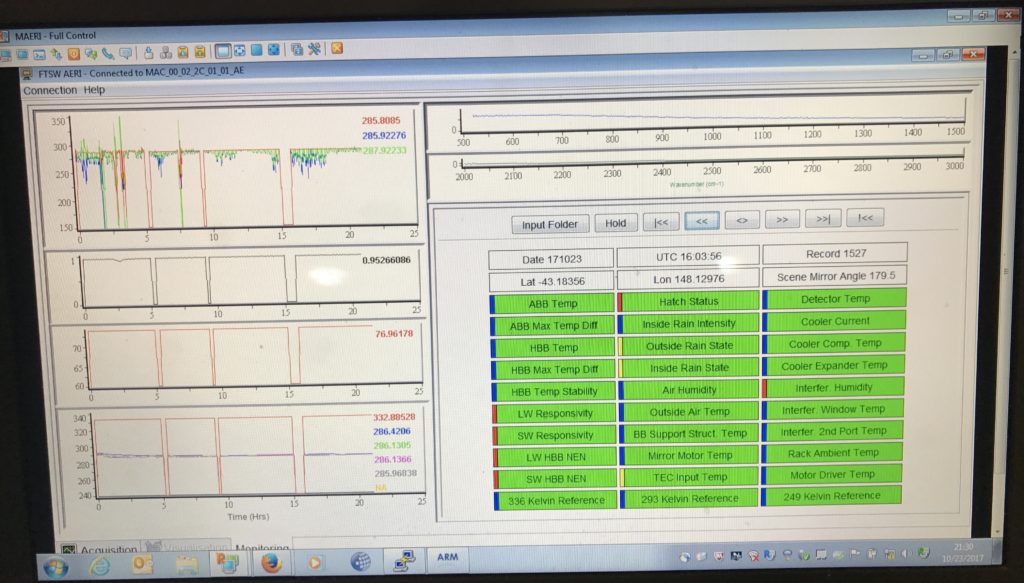
FTSW Monitoring tab
- Visualization of processed data
- Output is usually 5-15 mins old. Check UTC time display for time stamp
- Left panel shows time series of radiance and various housekeeping parameters. Software outages can be identified by missing values
- Right top panel shows calibrated radiance for each detector
- Right bottom panel shows the state of various housekeeping points
- Hover over a box to see current value
- Click on a box to see acceptable ranges
- Arrows at the top can be used to scroll through various records / times
| Scene | Letter designation |
Angle (deg from nadir) |
| Blackbodies | H, A | 240, 300 |
| Zenith Sky | S, T, U, V, W, X, Y, Z | 180 |
| Sea/Ice | D, E, F, G | 55, 60, 65, 70 |
| Slant-sky | O, P, Q, R, K | 125, 120, 115, 110, 95 |
Table 1: M-AERI scan sequence
On-ice scan sequence: H,A,S, D,O,T, F,Q,U, K,V,… Approx. duration 3.5 mins
On-water scan sequence: H,A,S, D,O,T, E,P,U, F,Q,V, G,R,W,… Approx. duration 10 mins
Figure 1: VM Desktop & Ingest windows
Figure 2: FTSW Acquisition tab
Figure 3: FTSW Monitoring tab


