Figures/SNPP
Daily and weekly time series of SNPP VIIRS SRB reflectance since December 2016
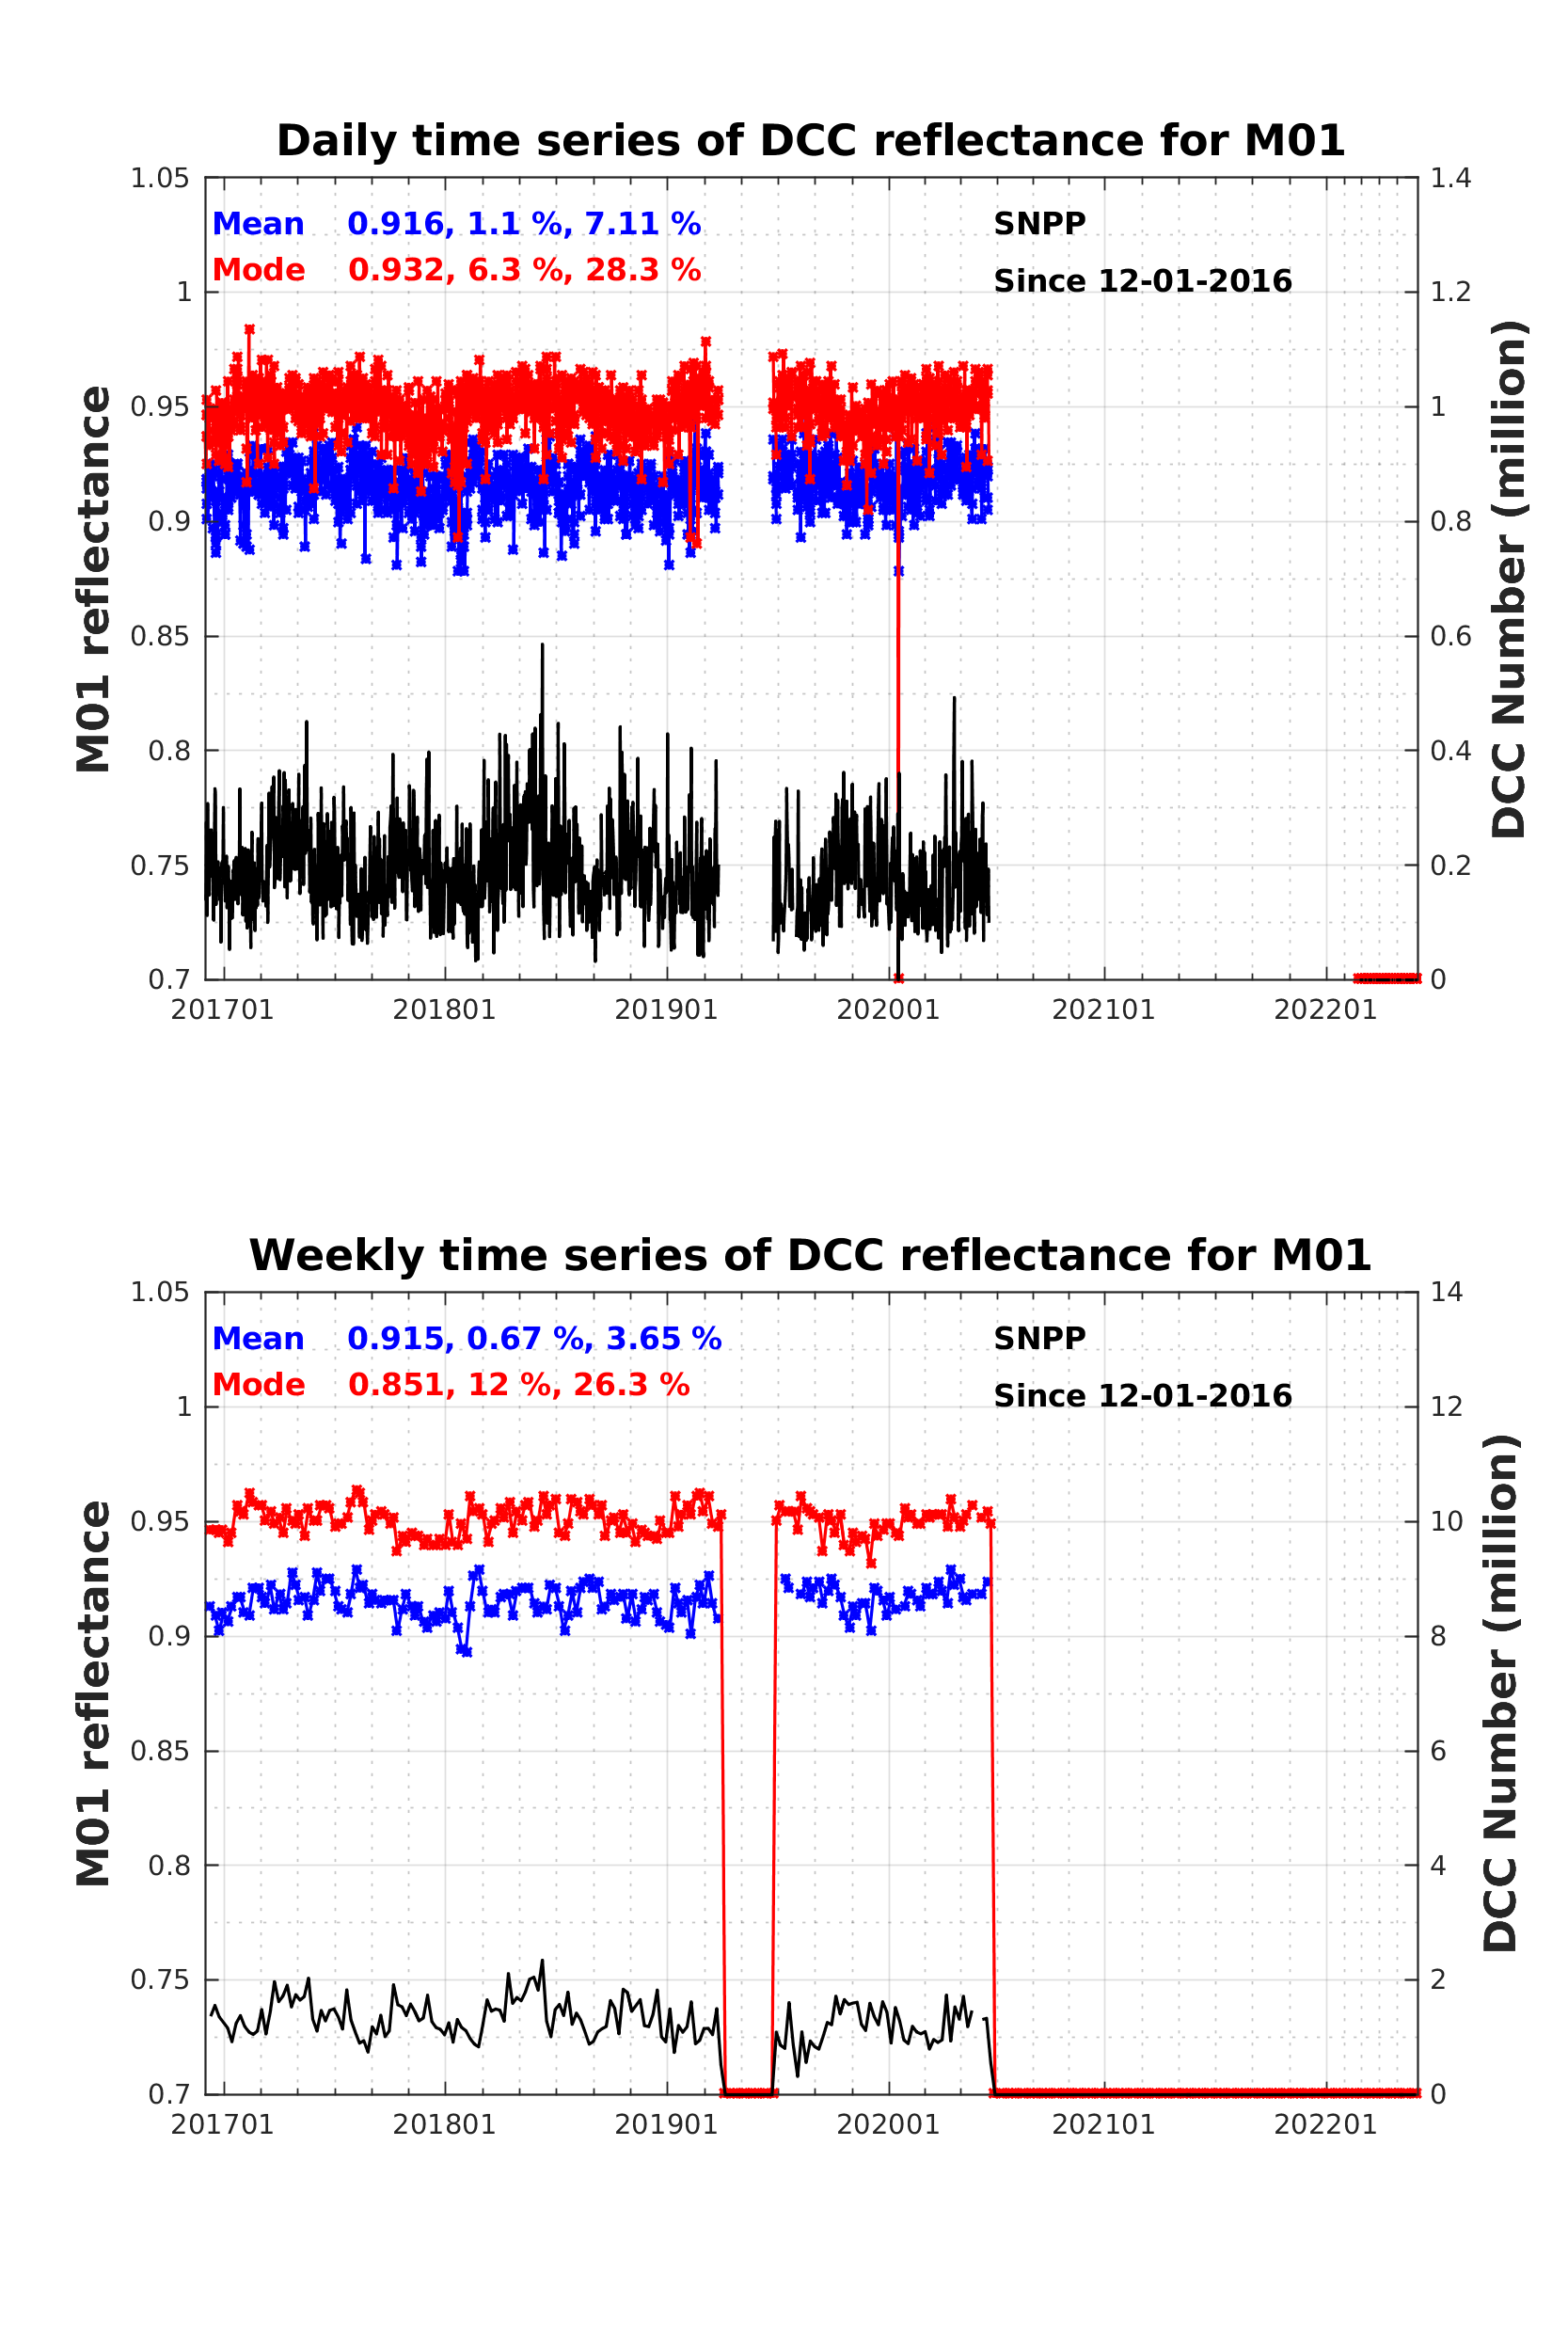
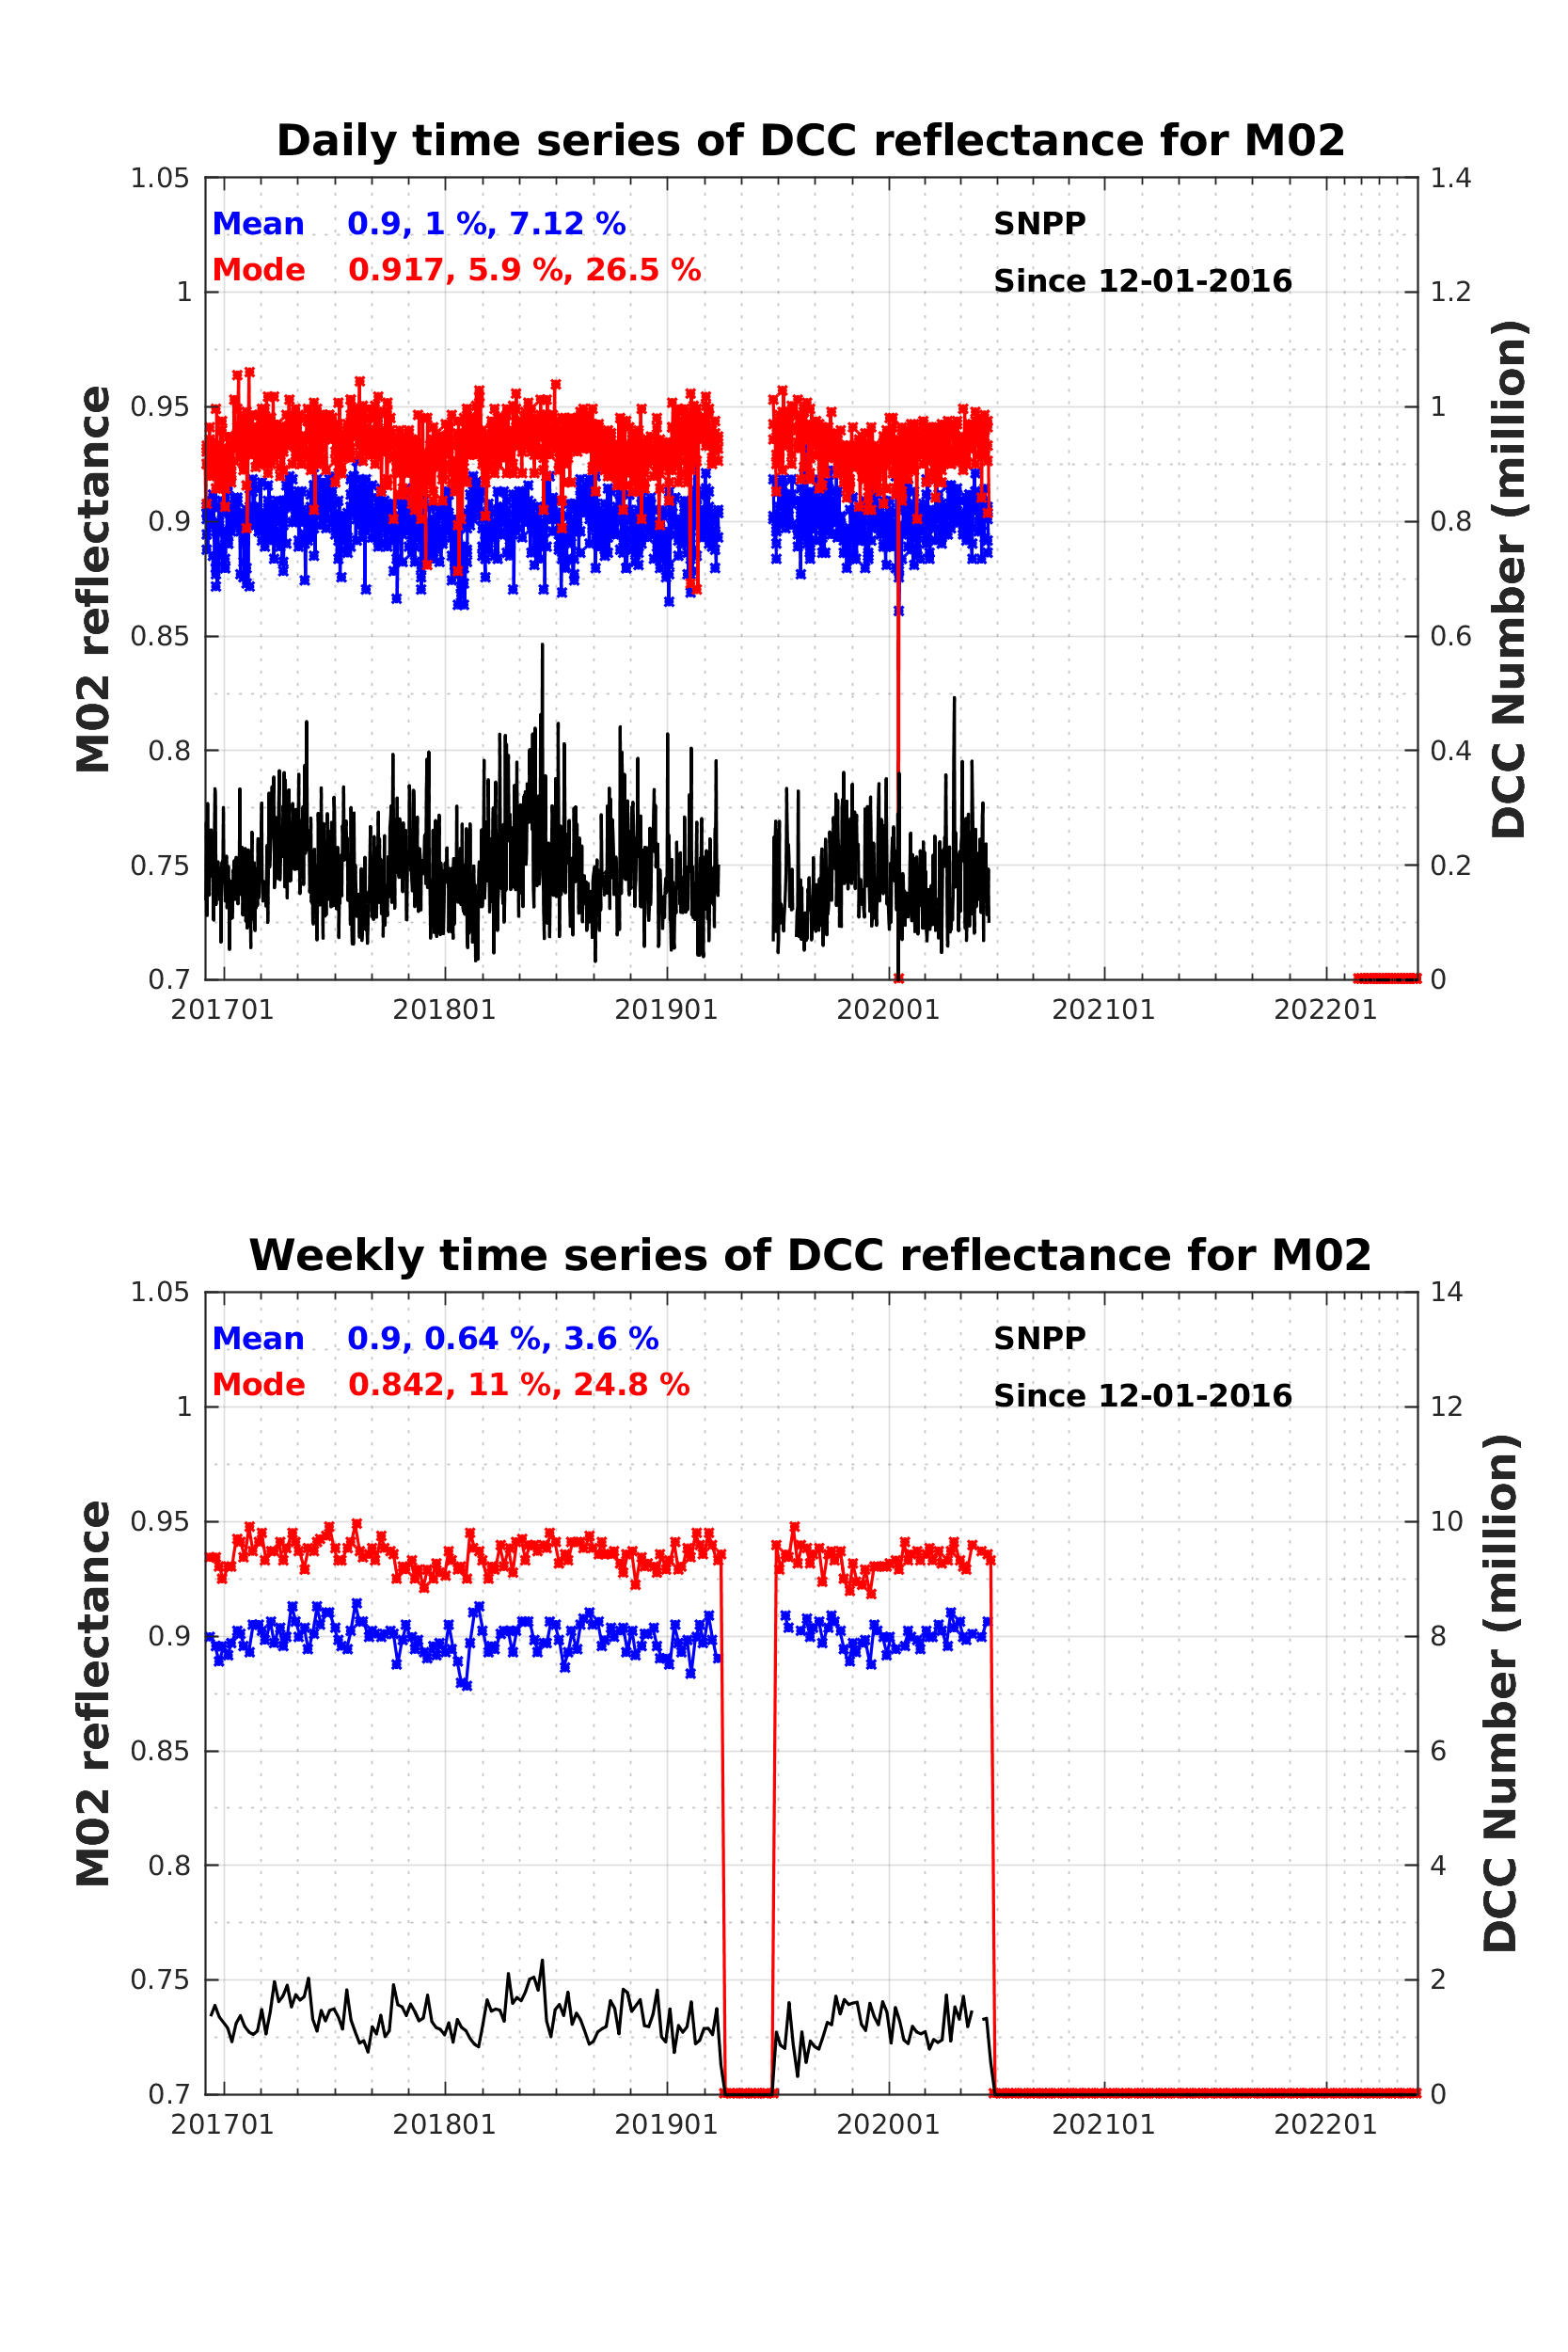
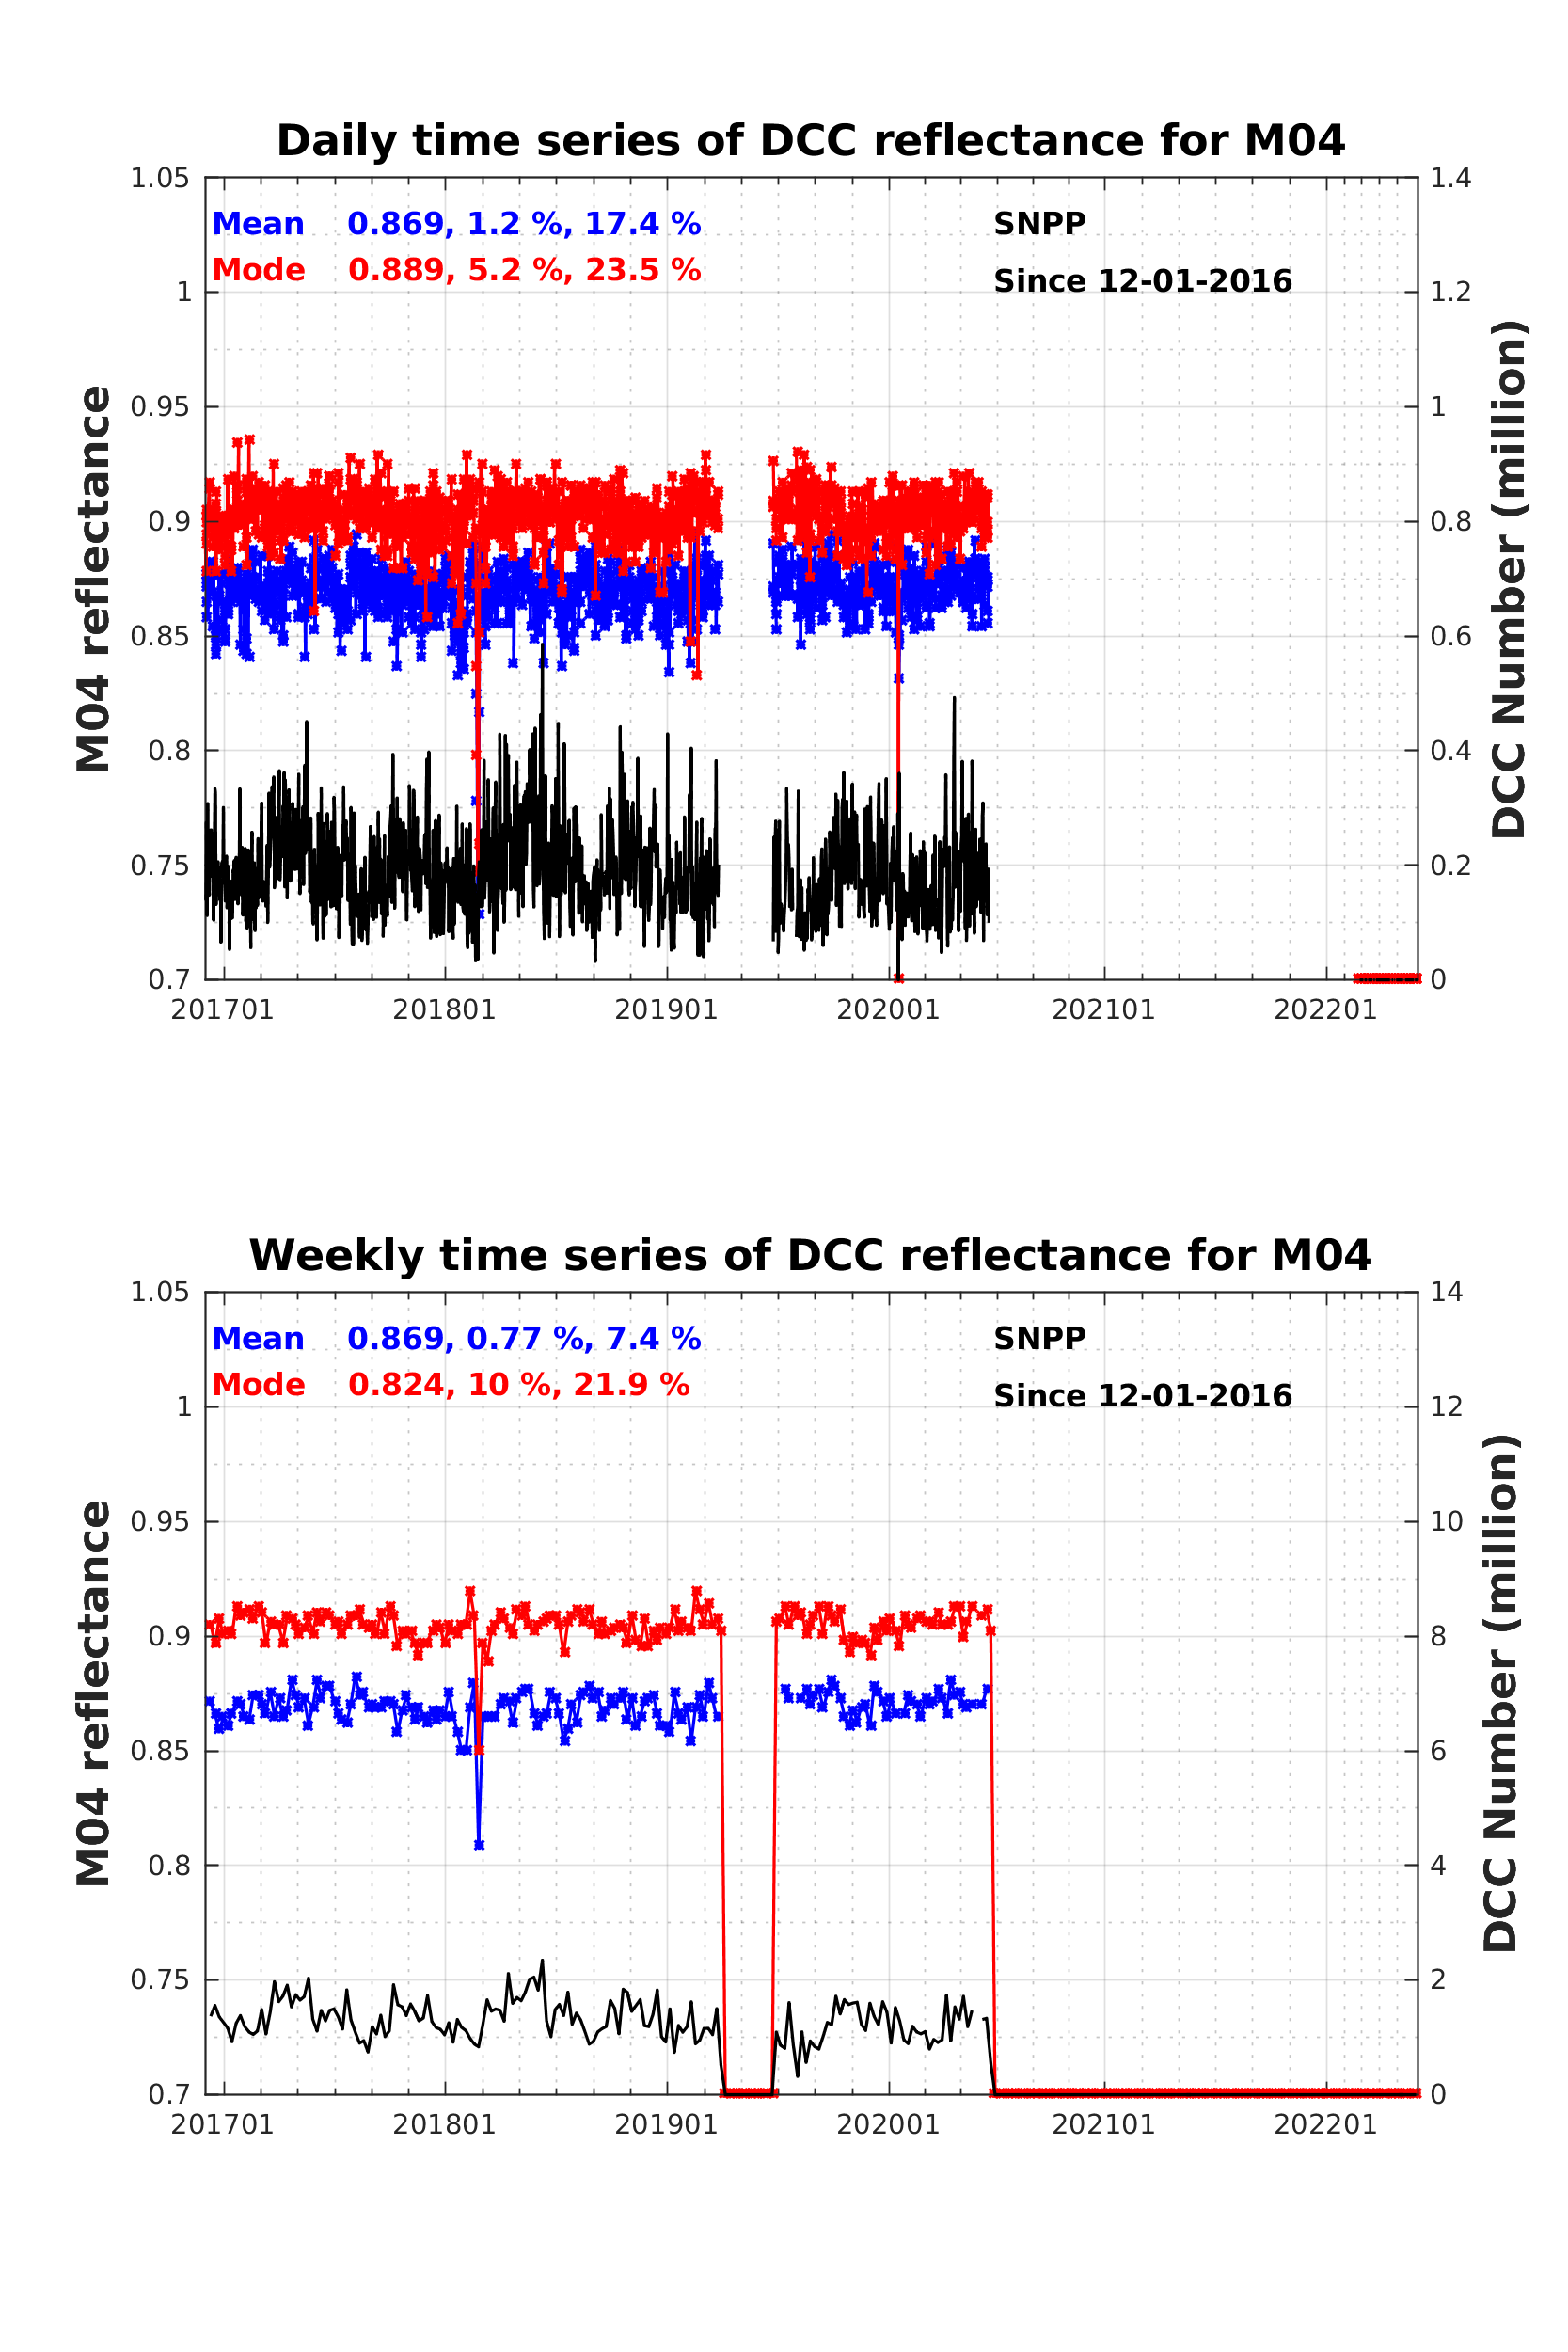
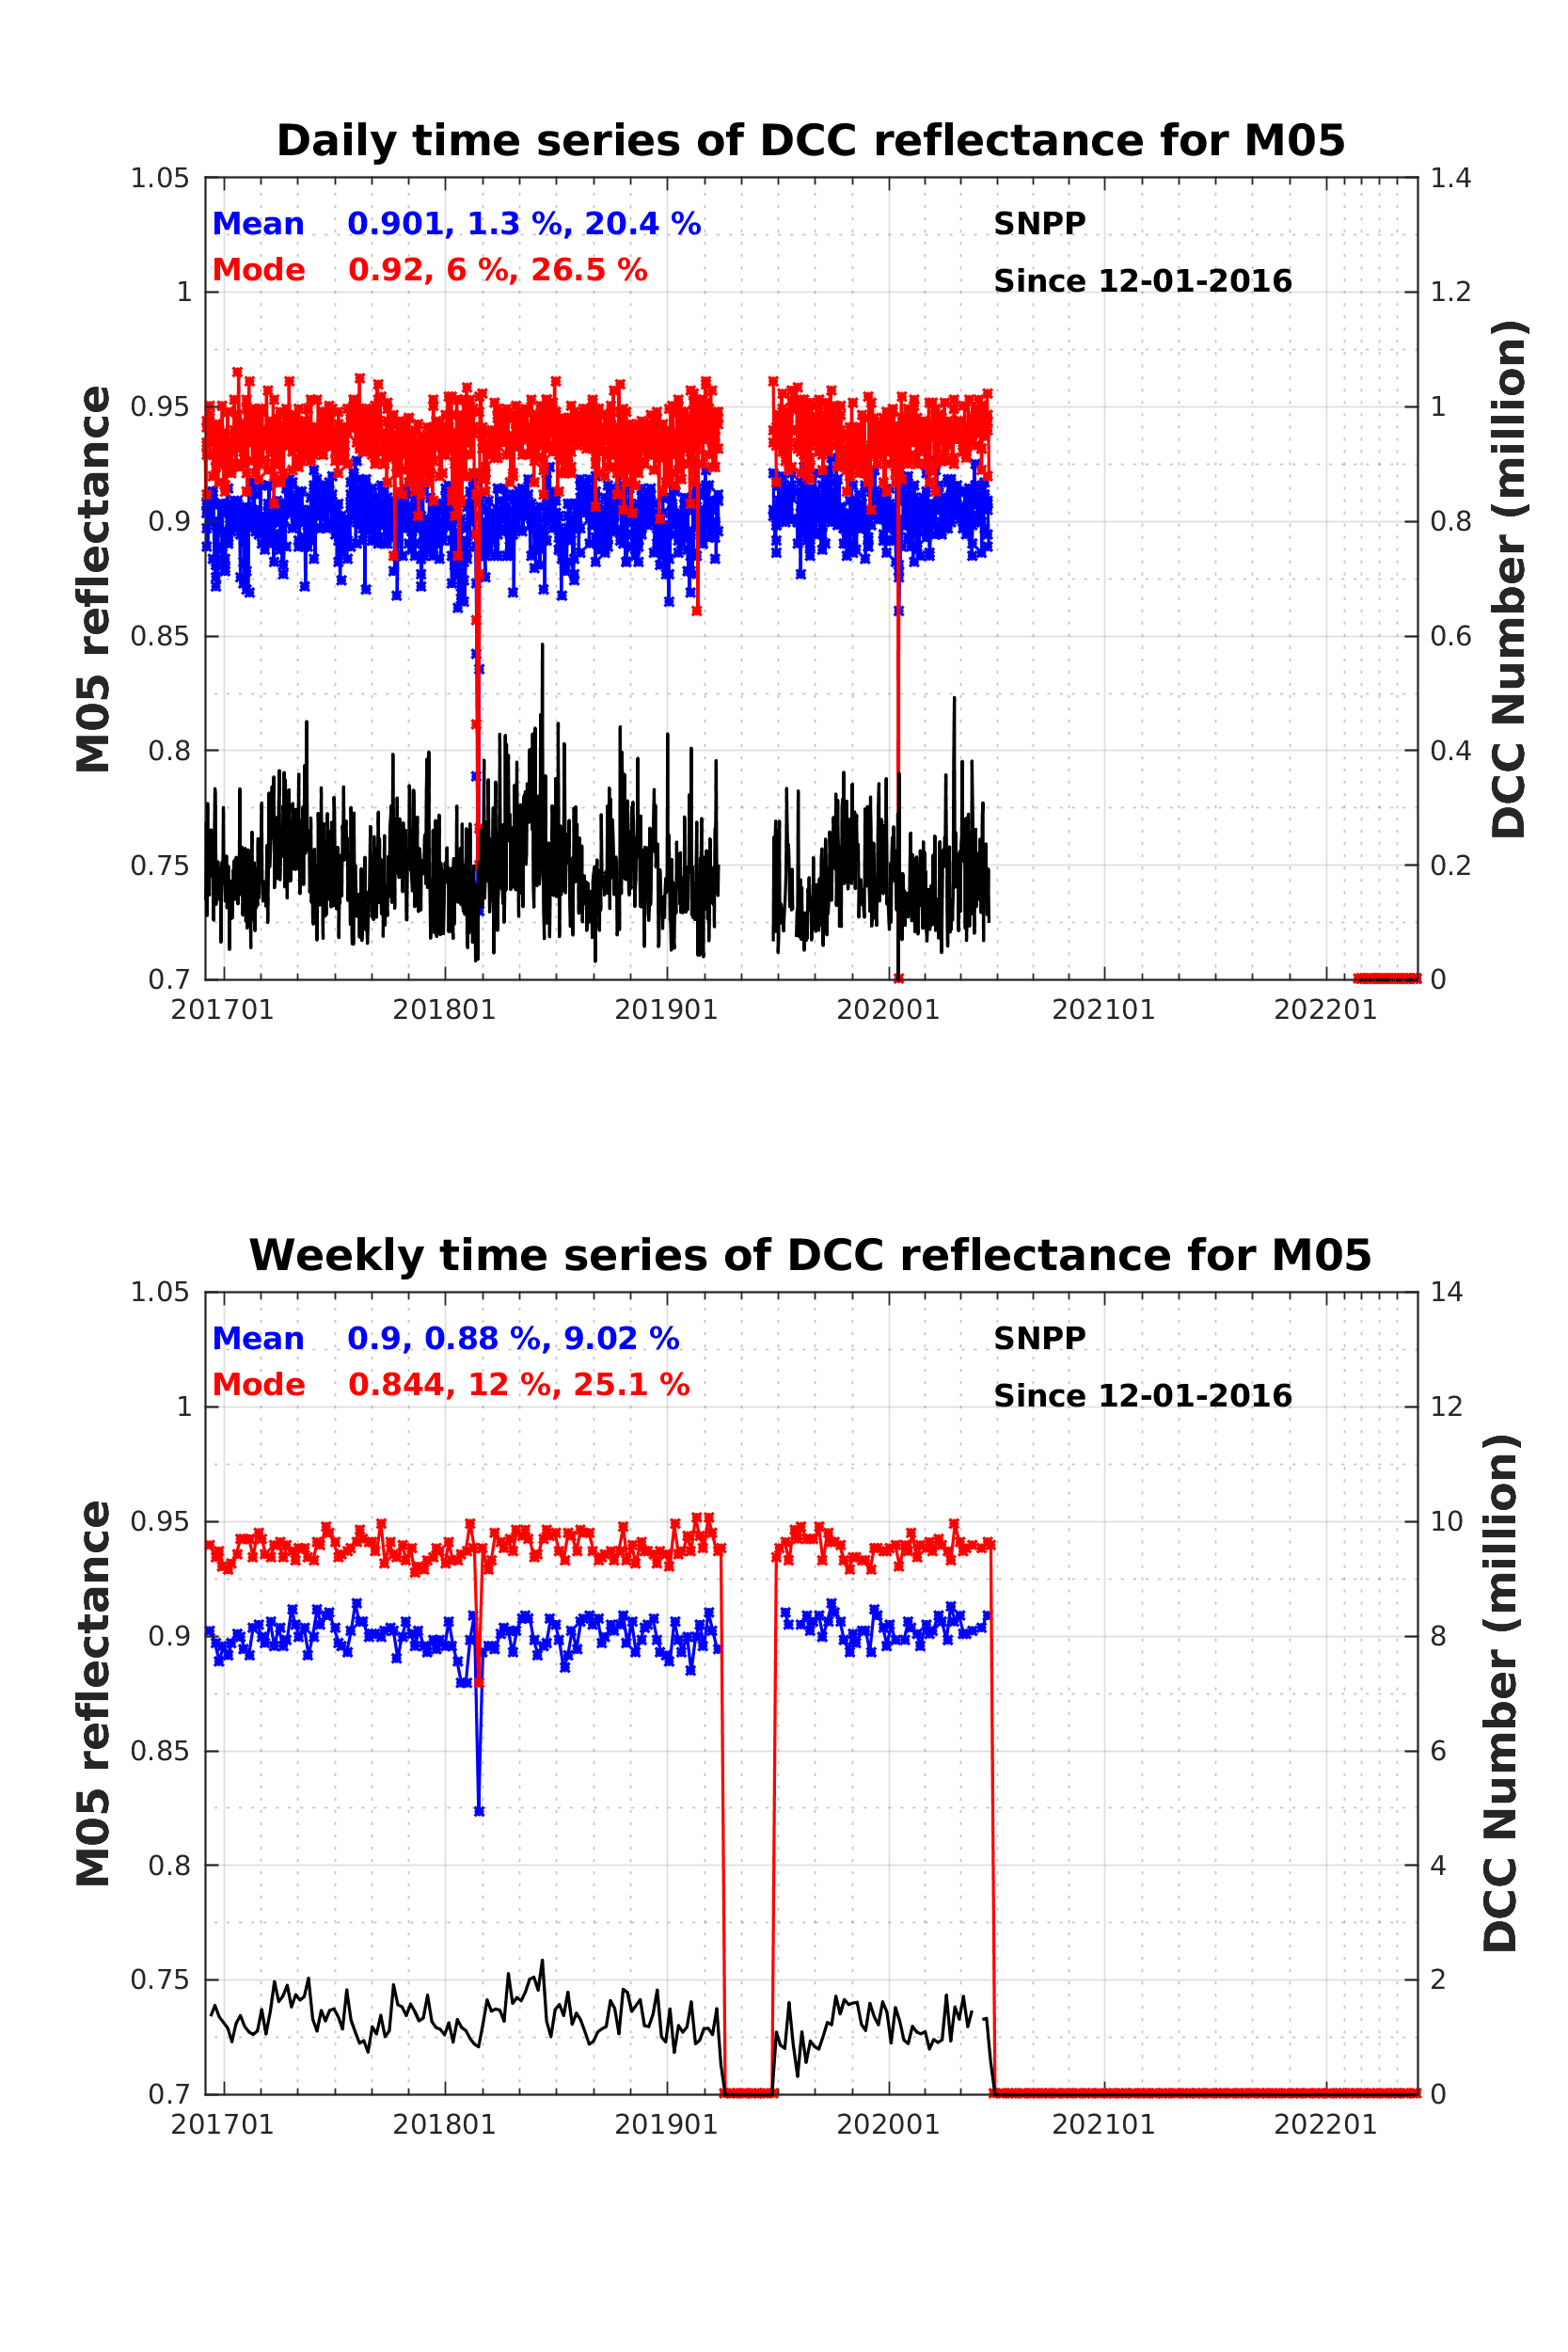
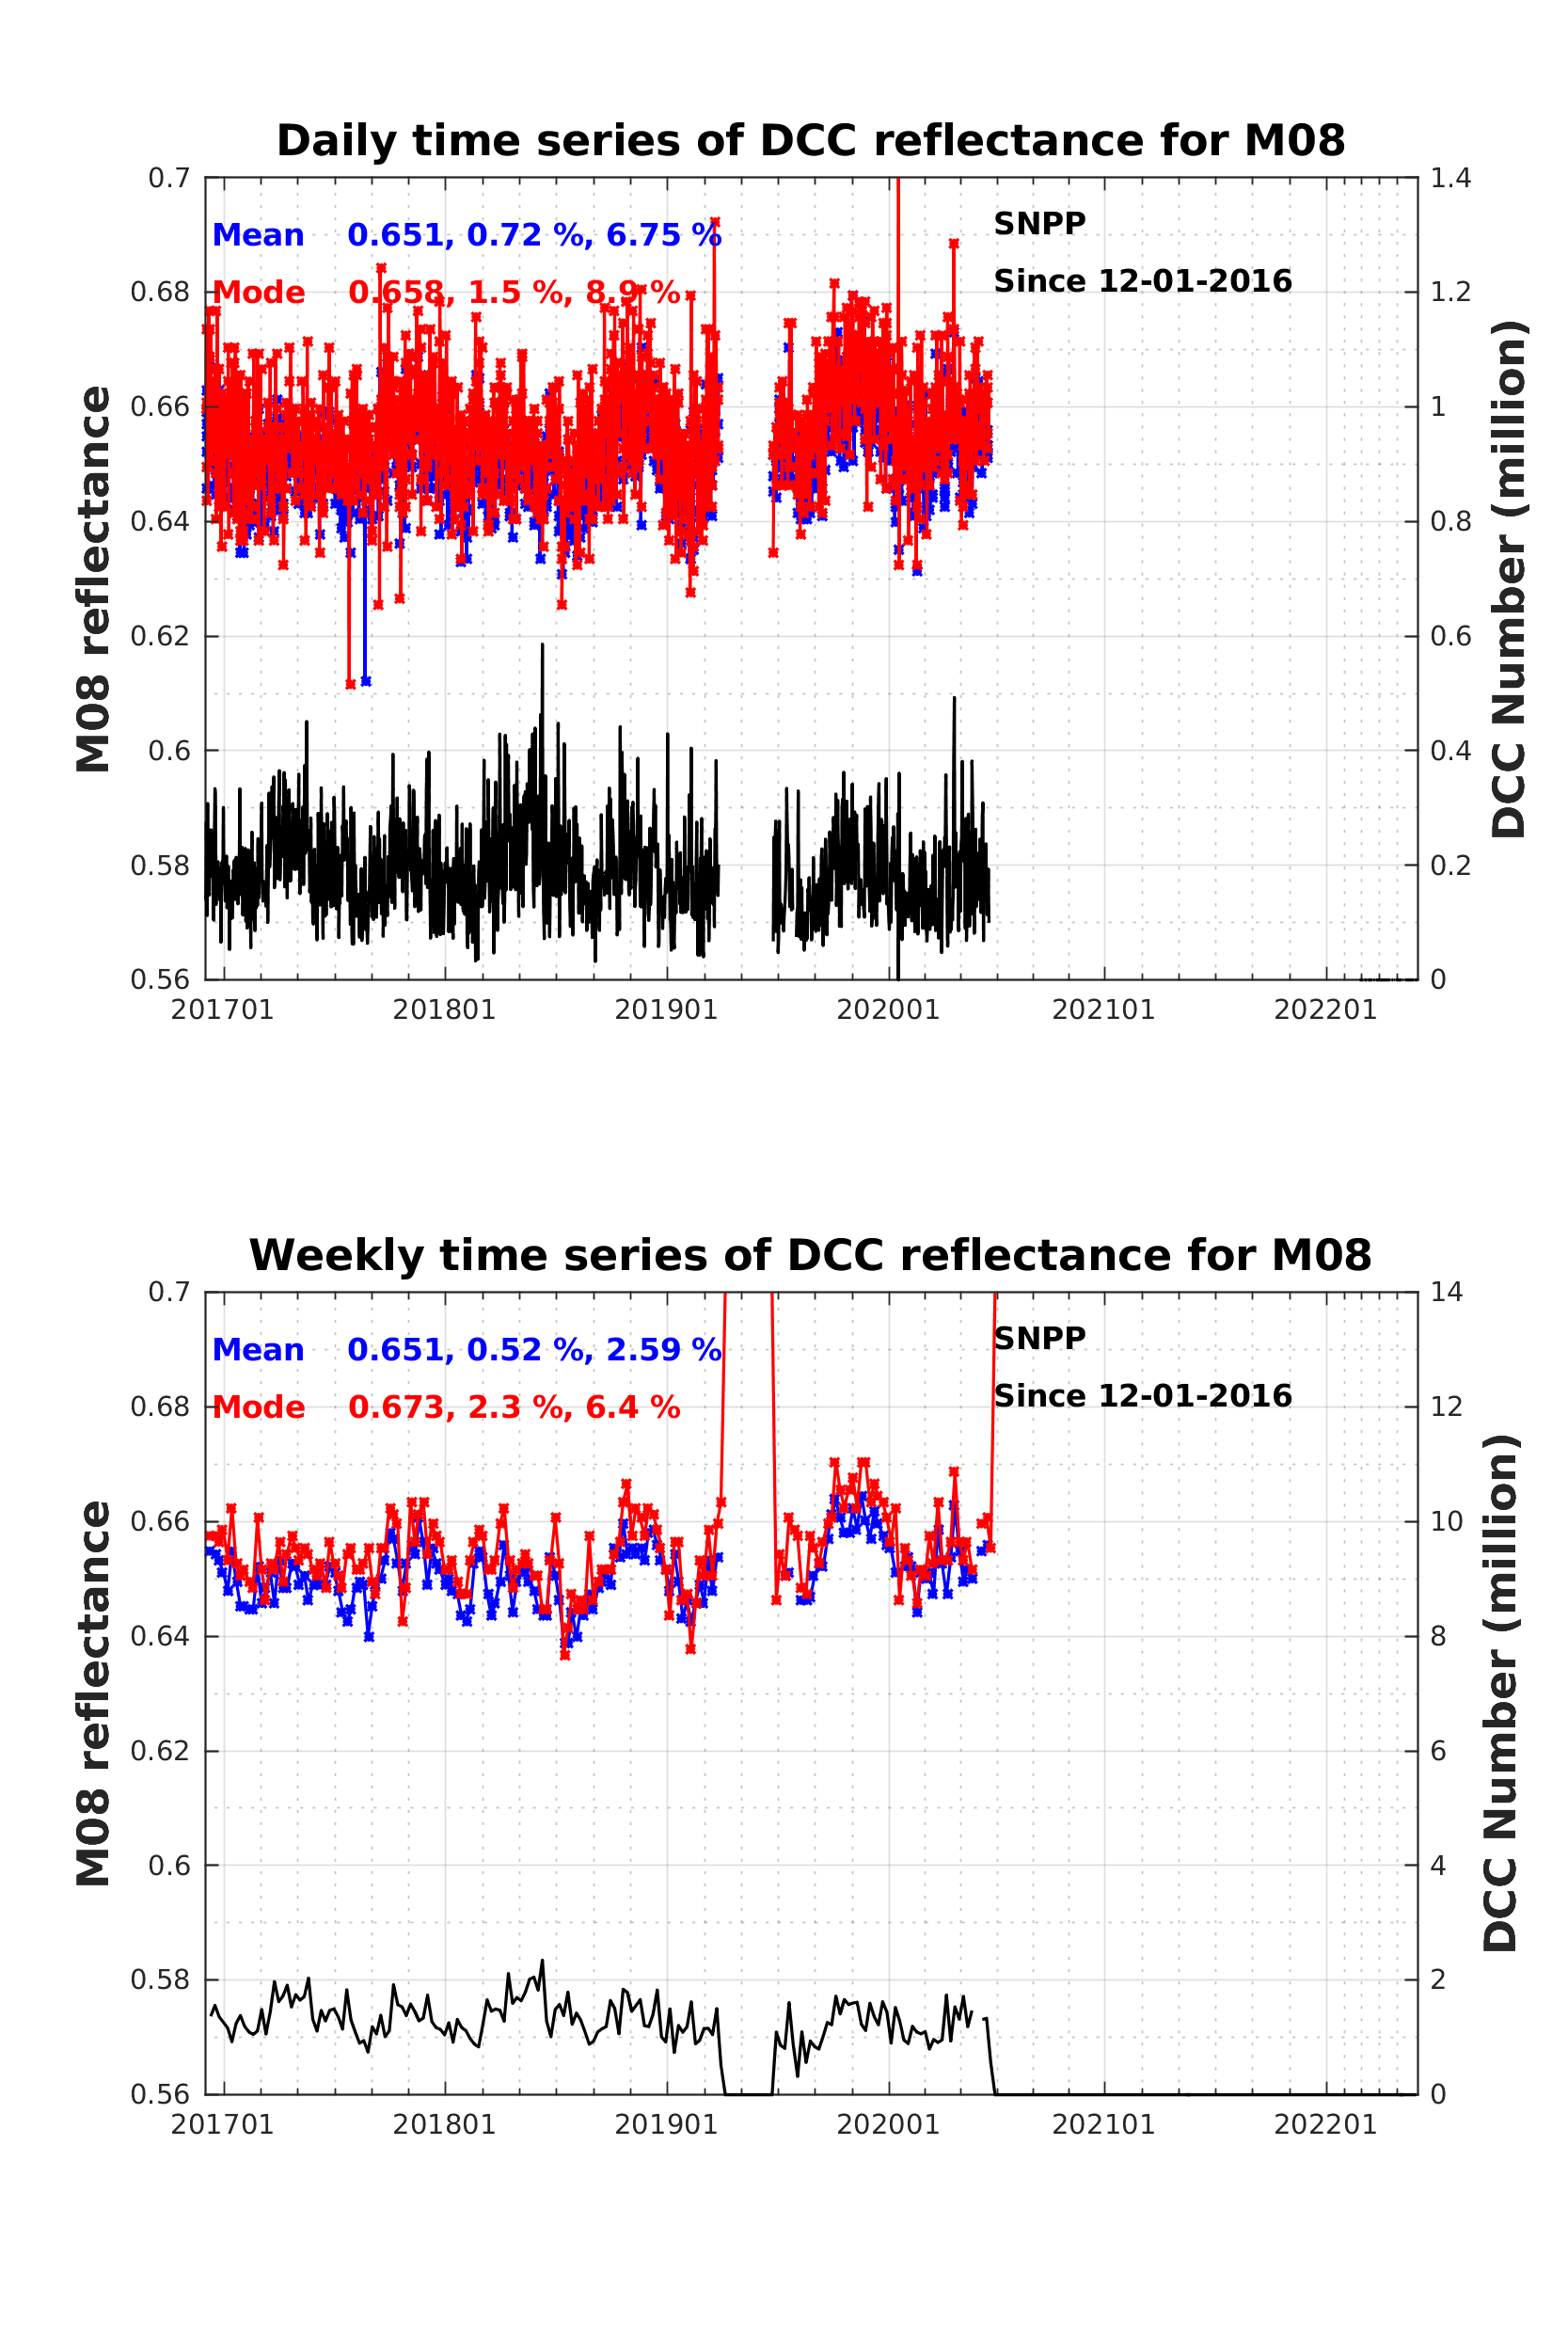
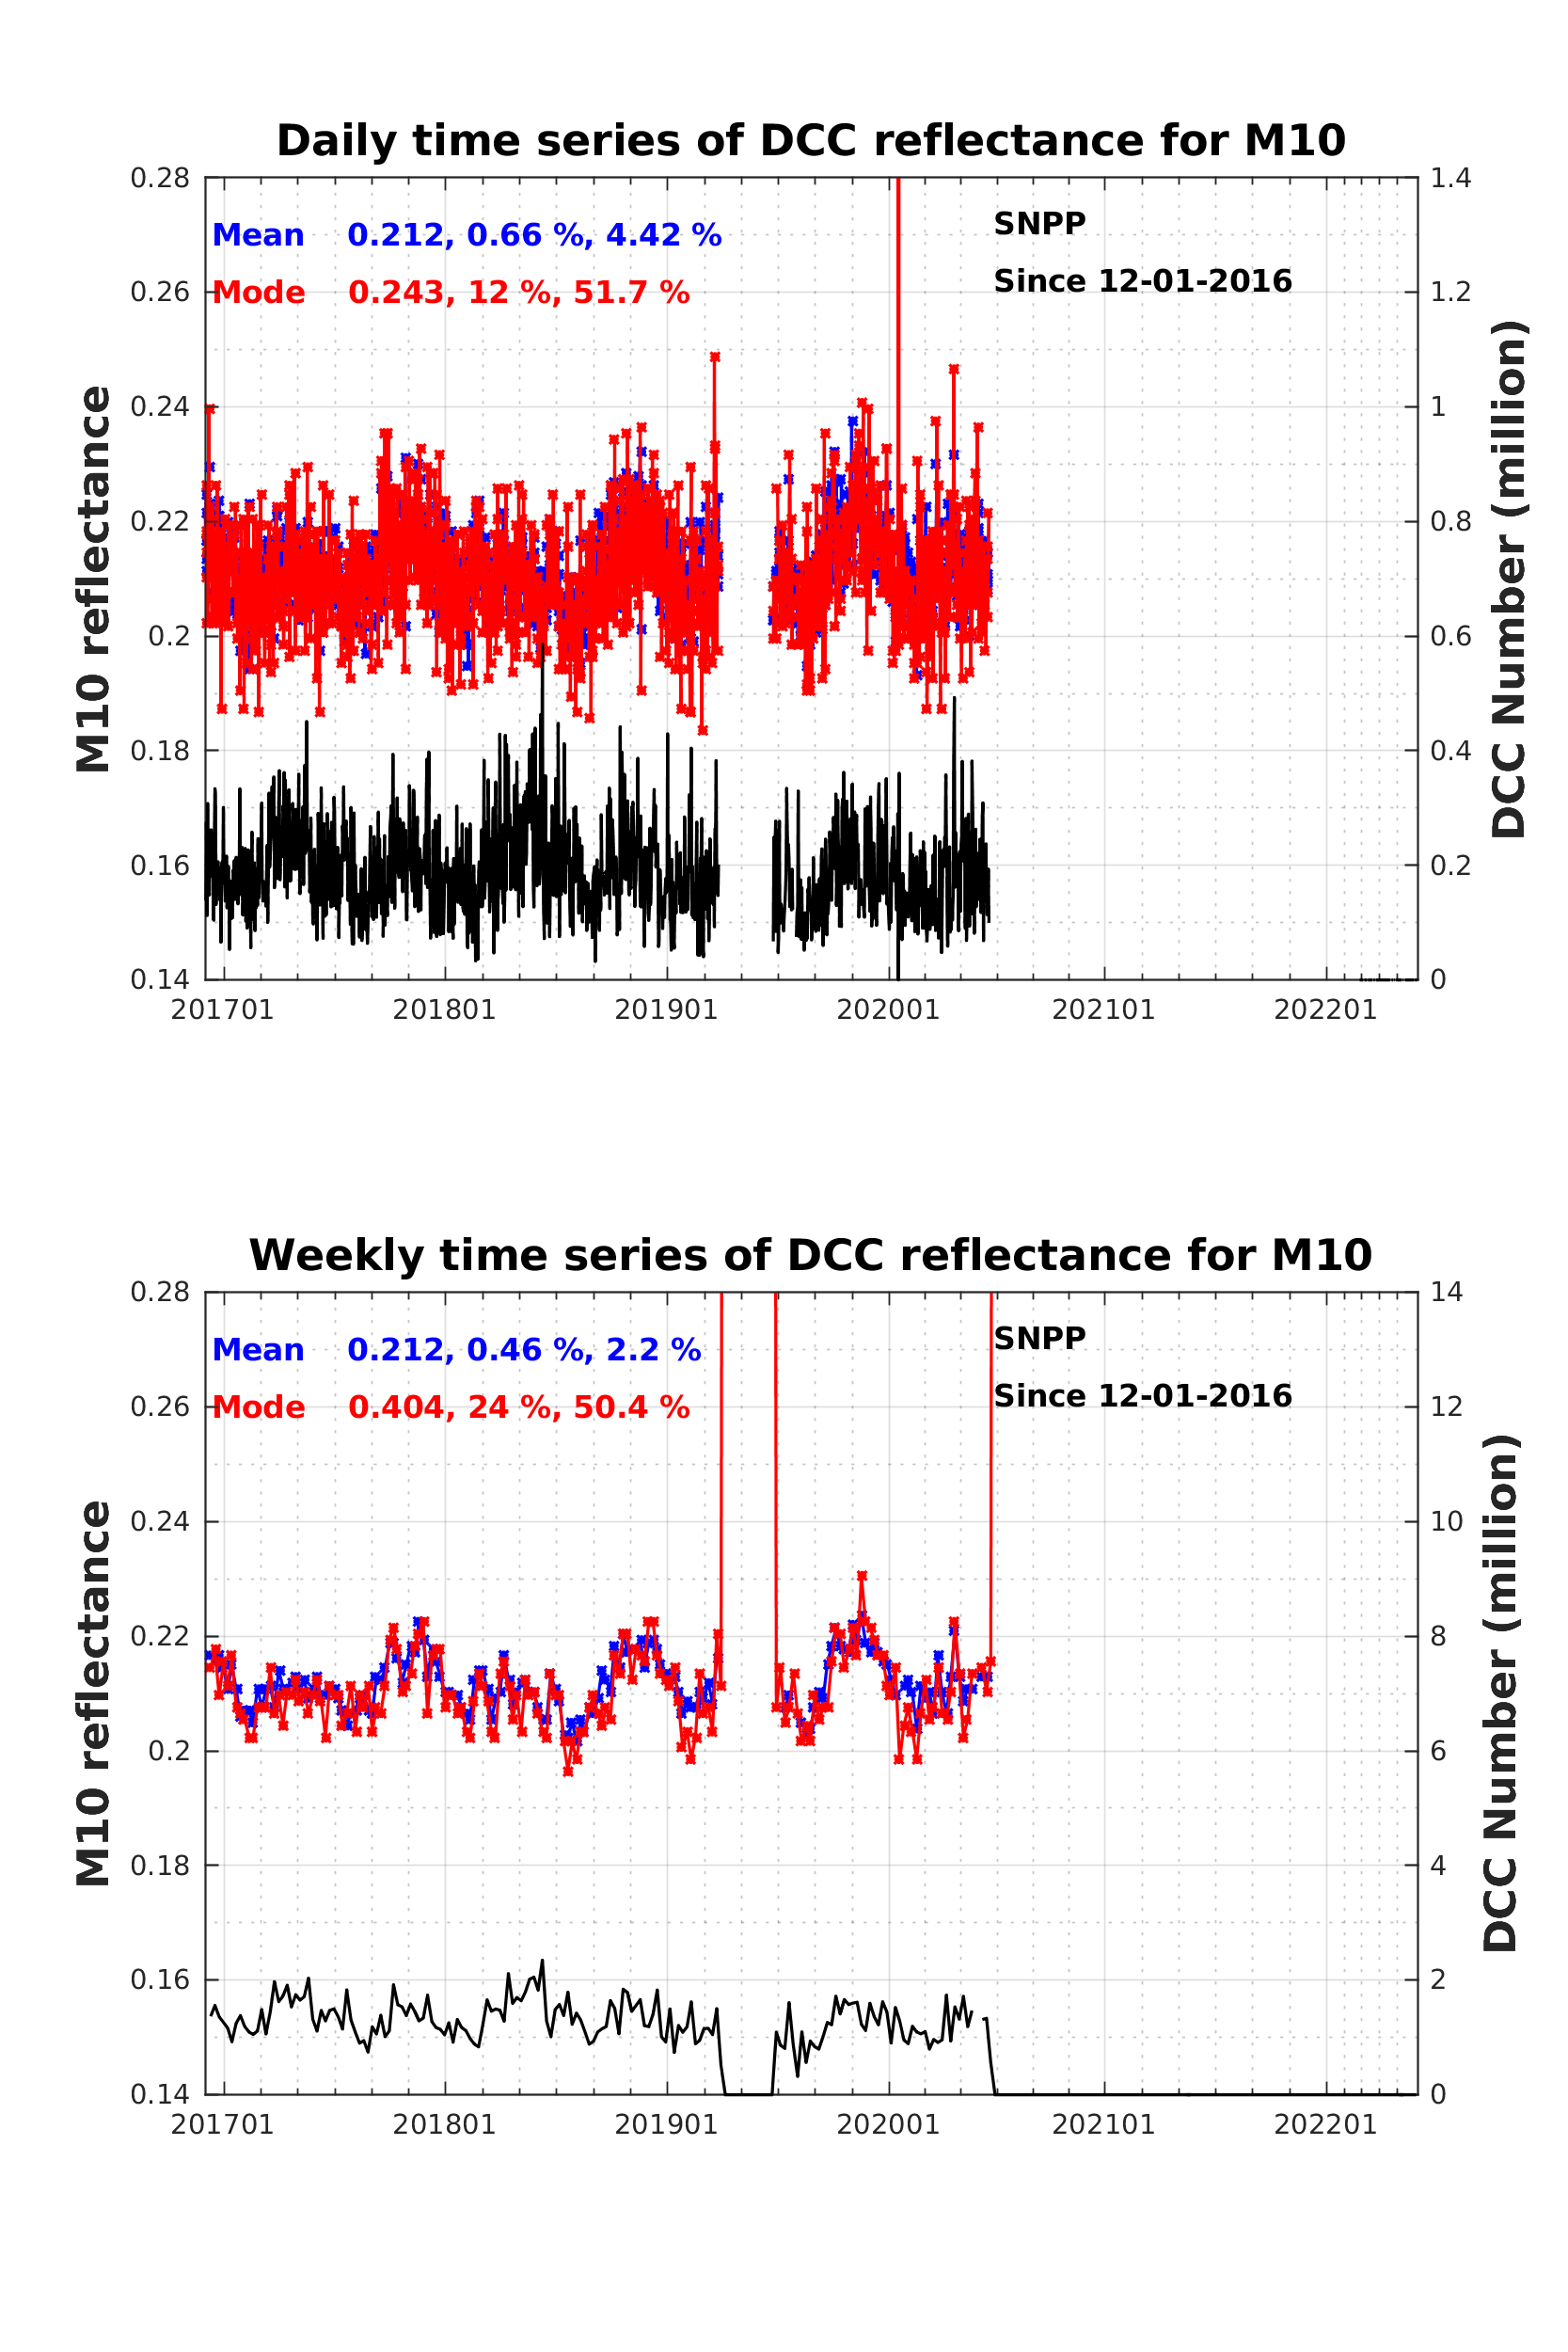
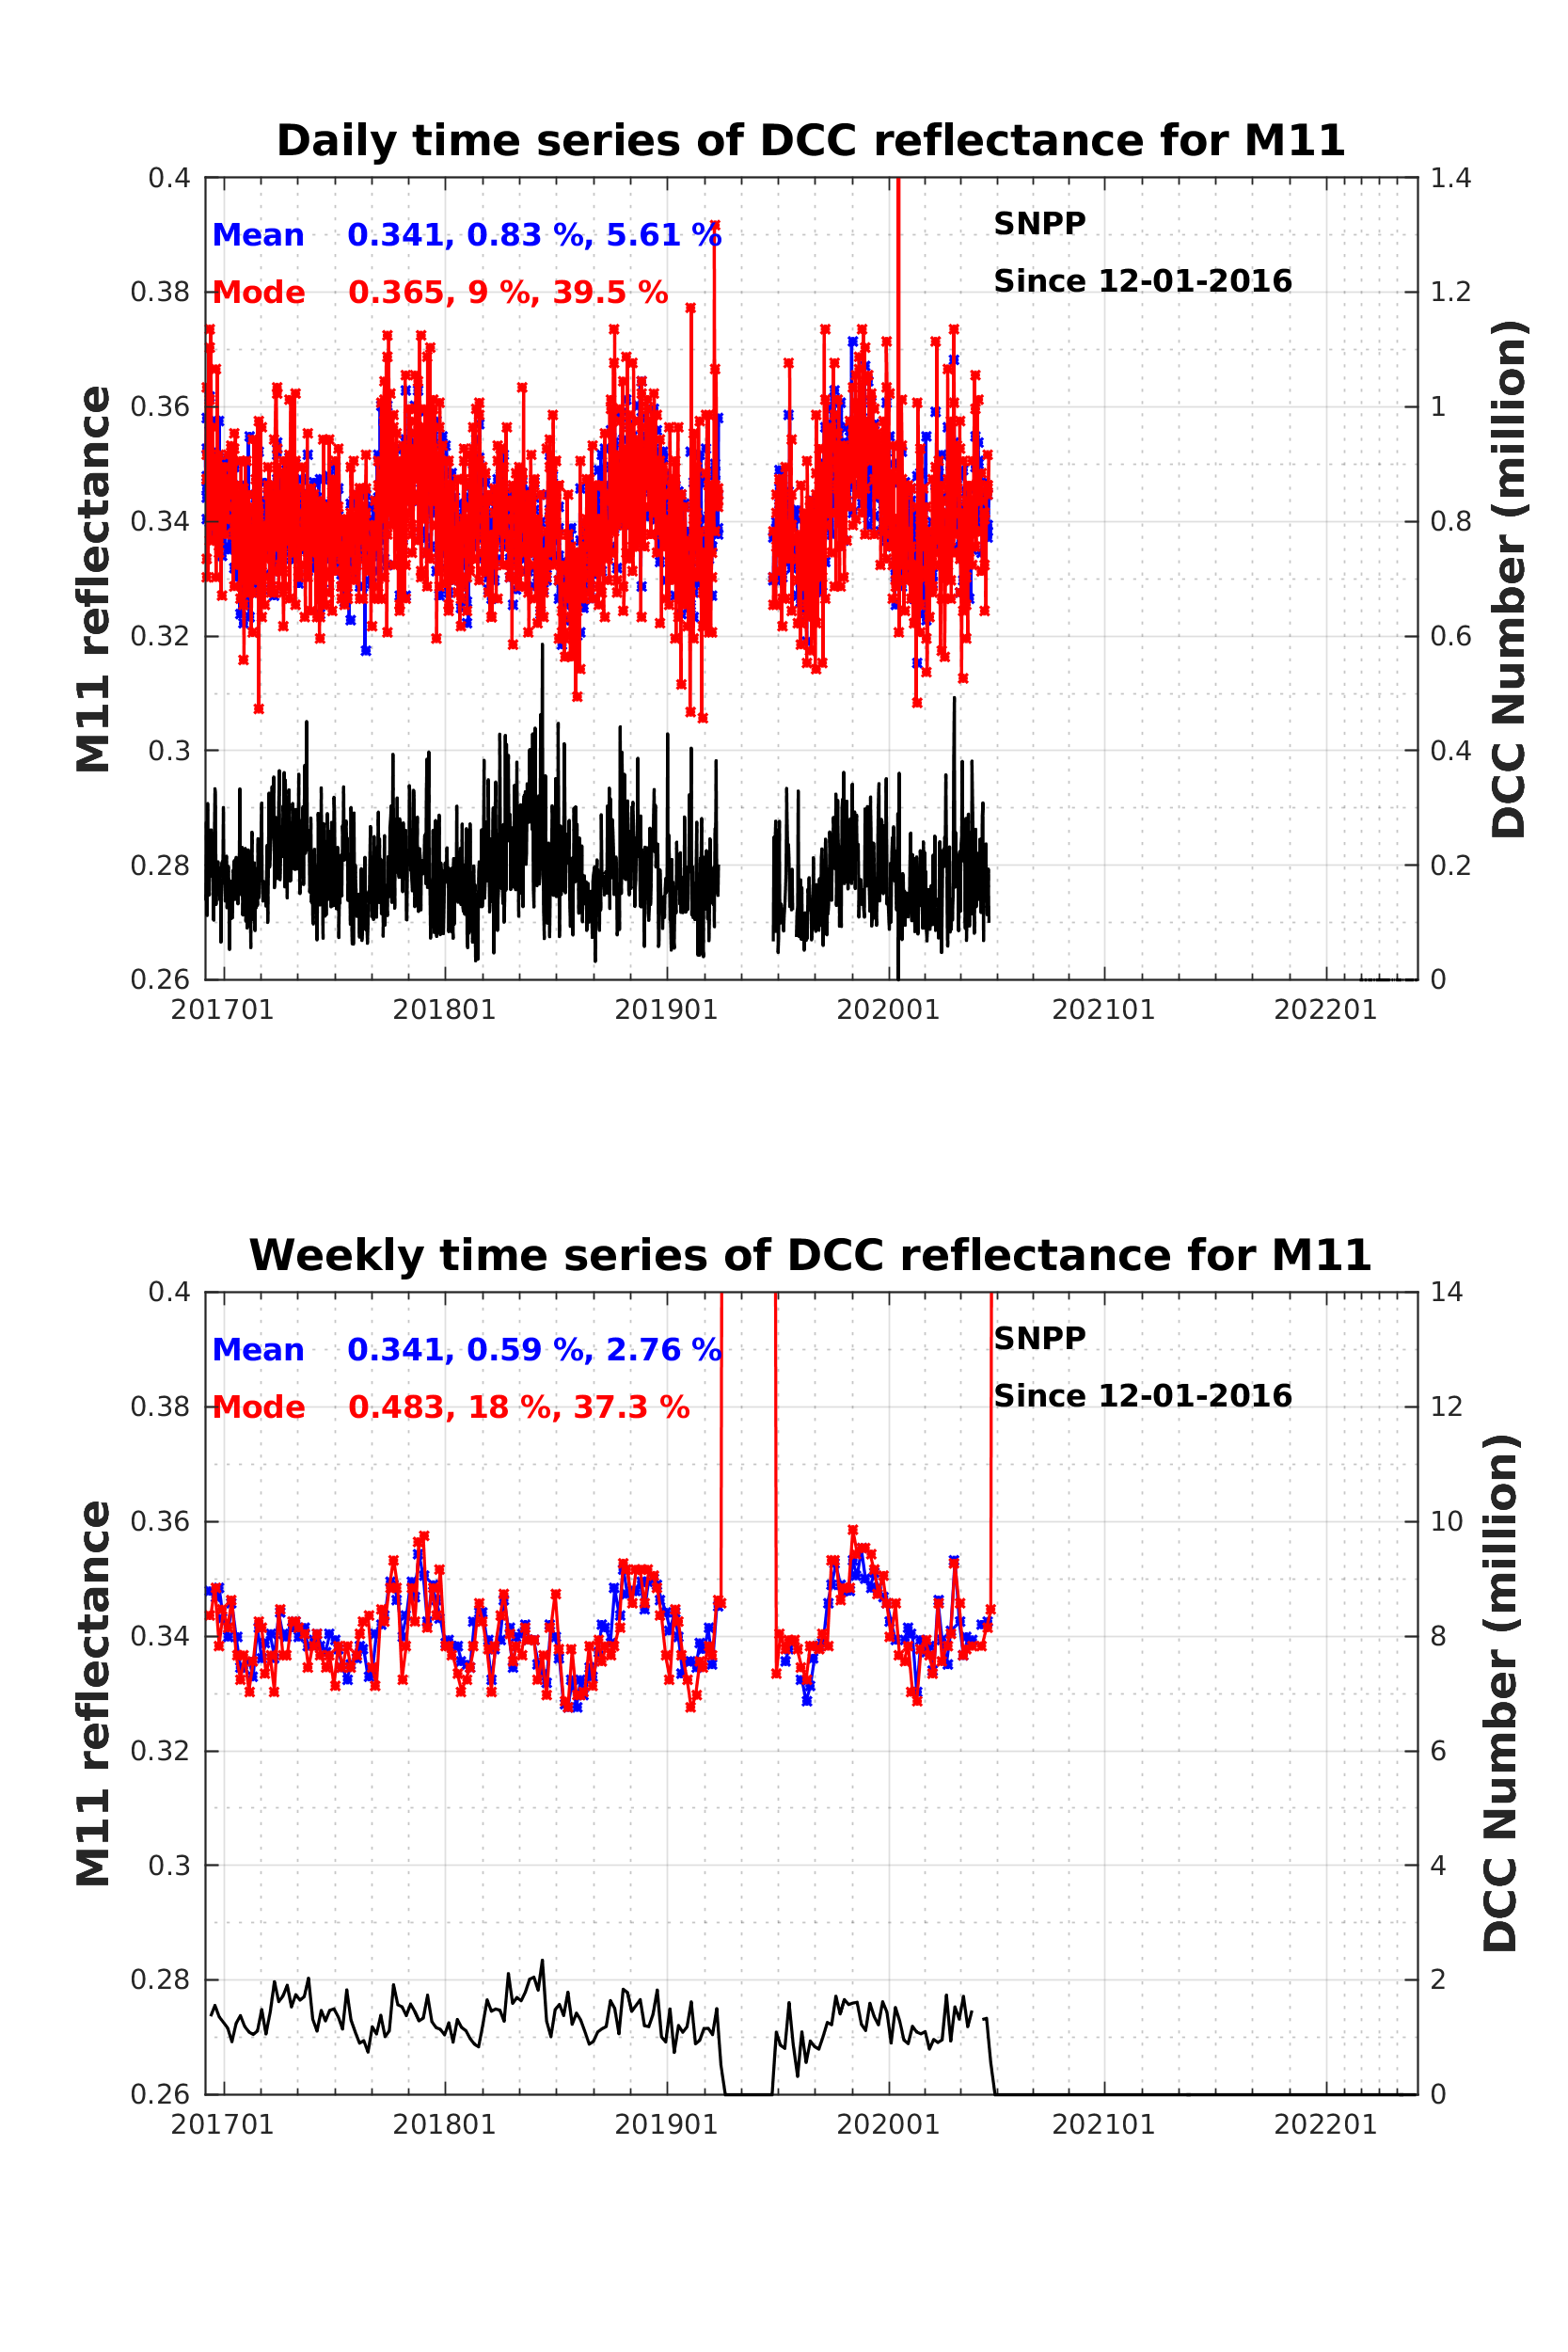
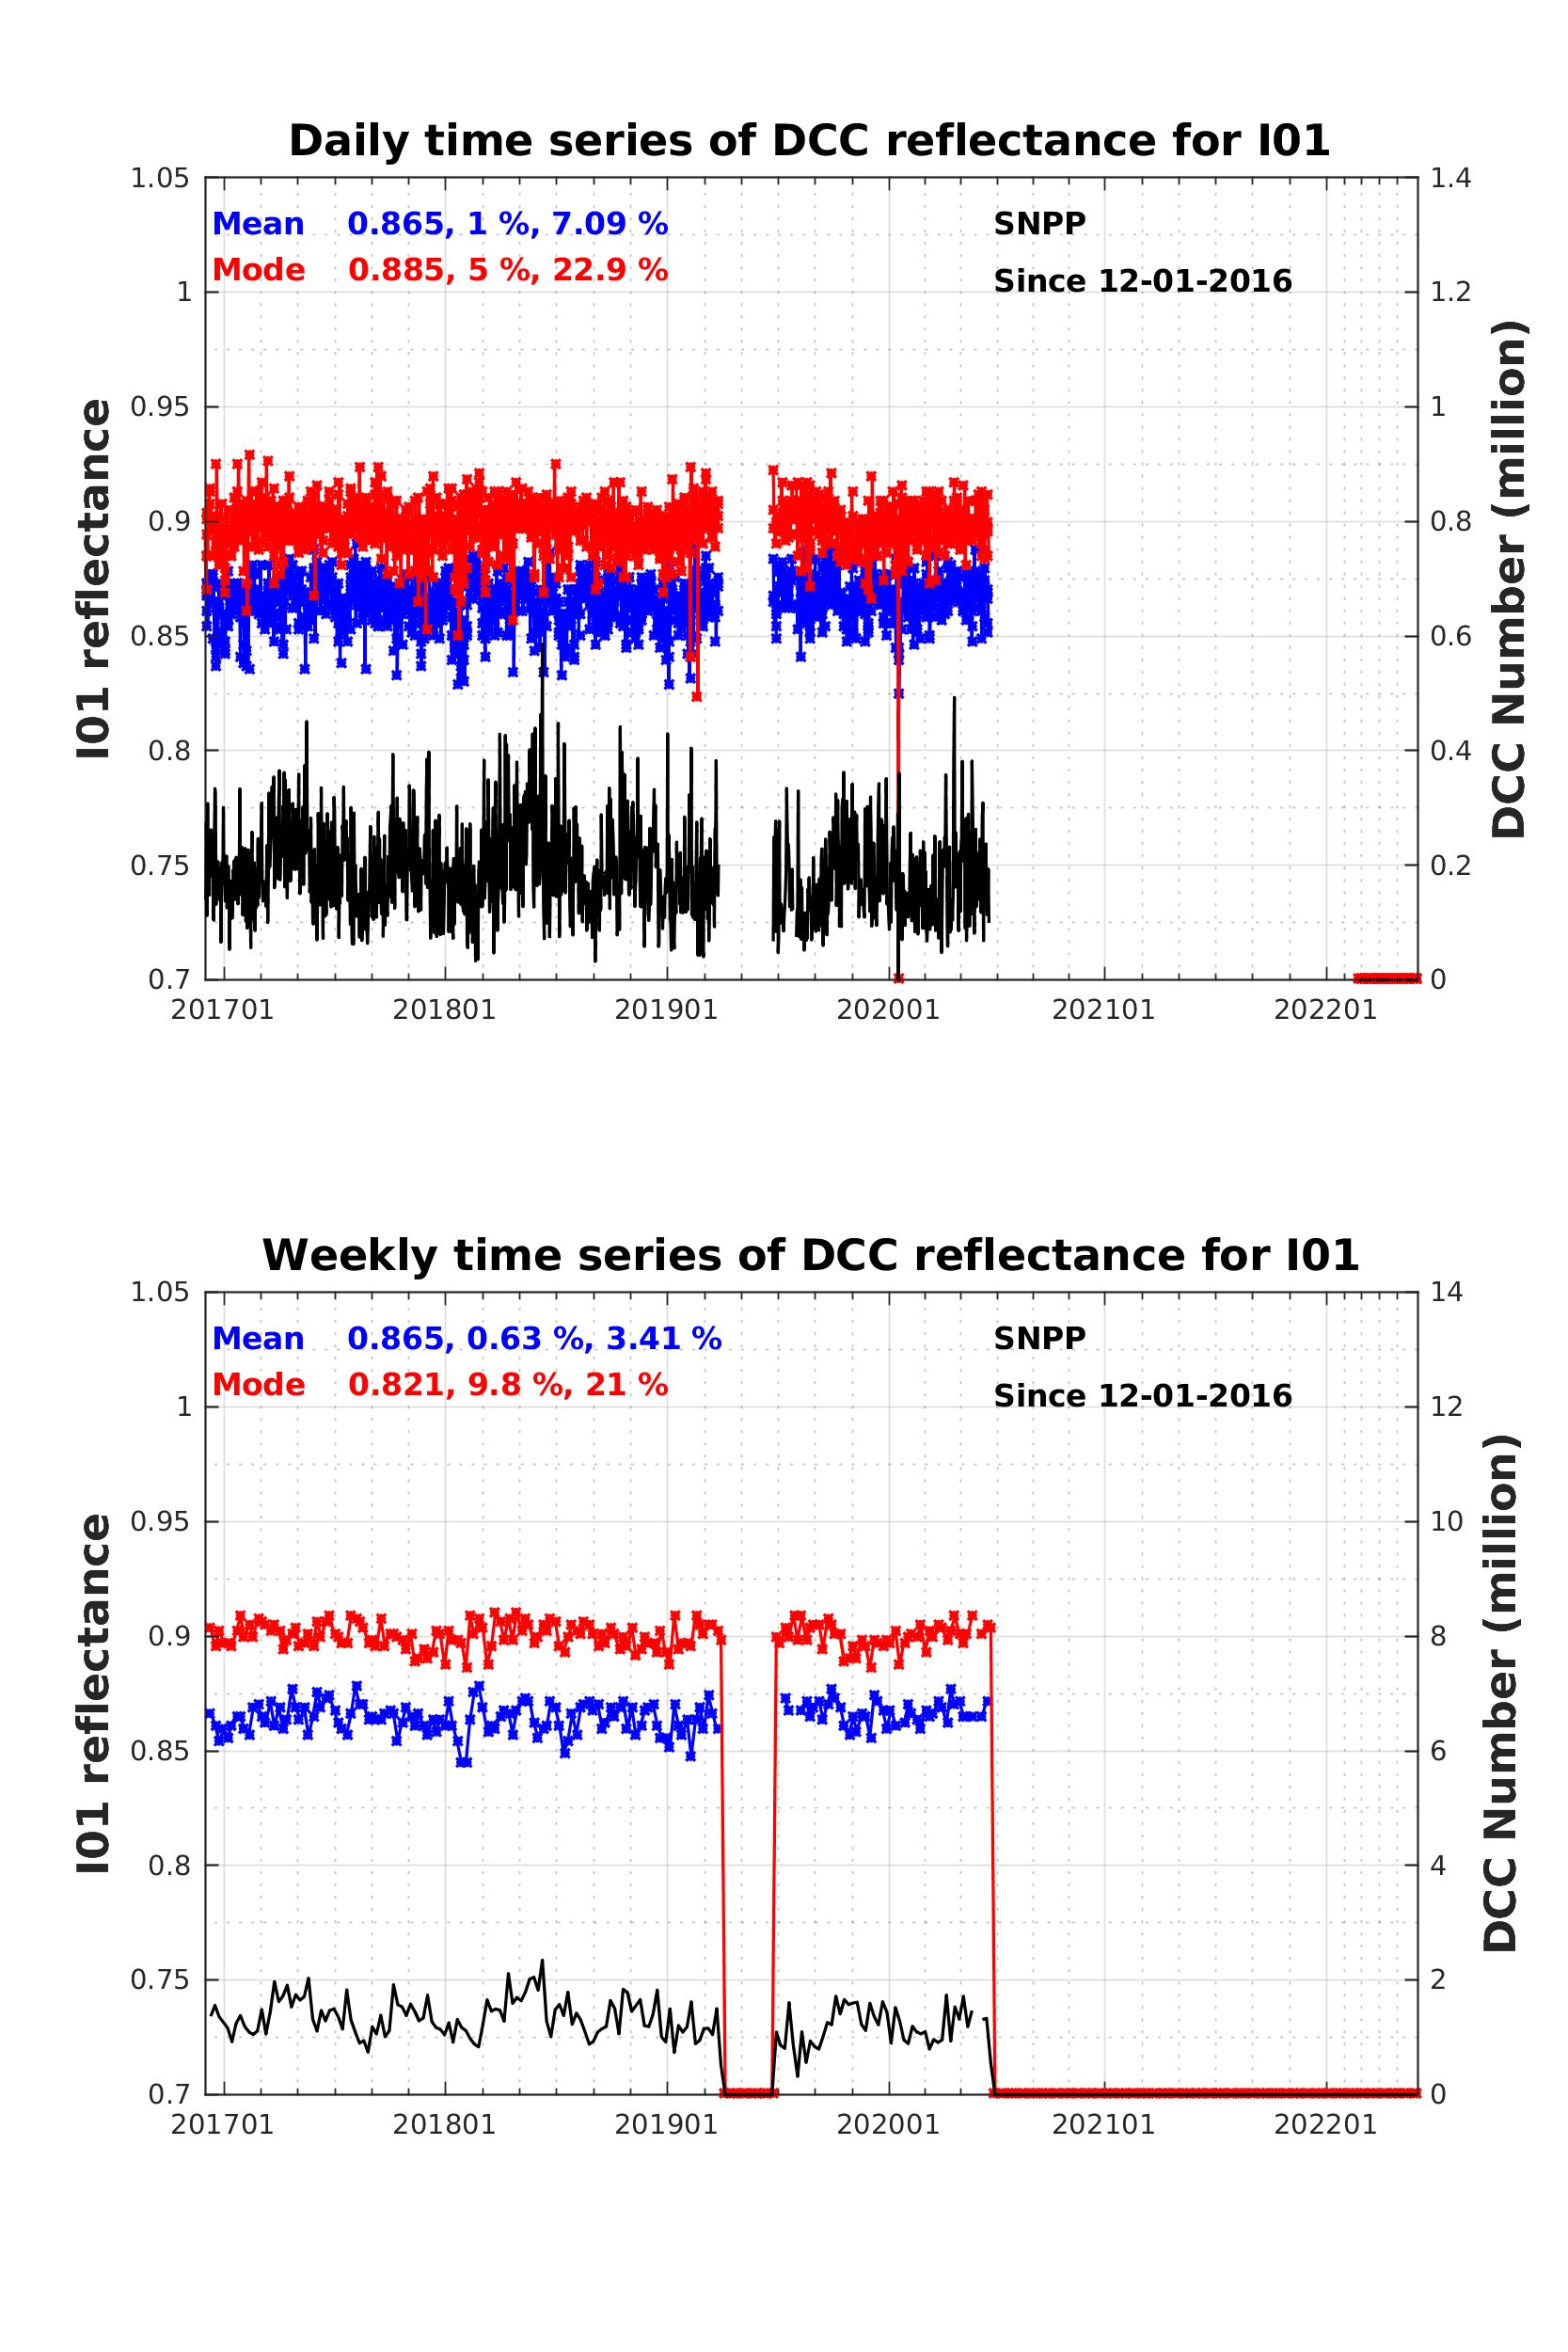
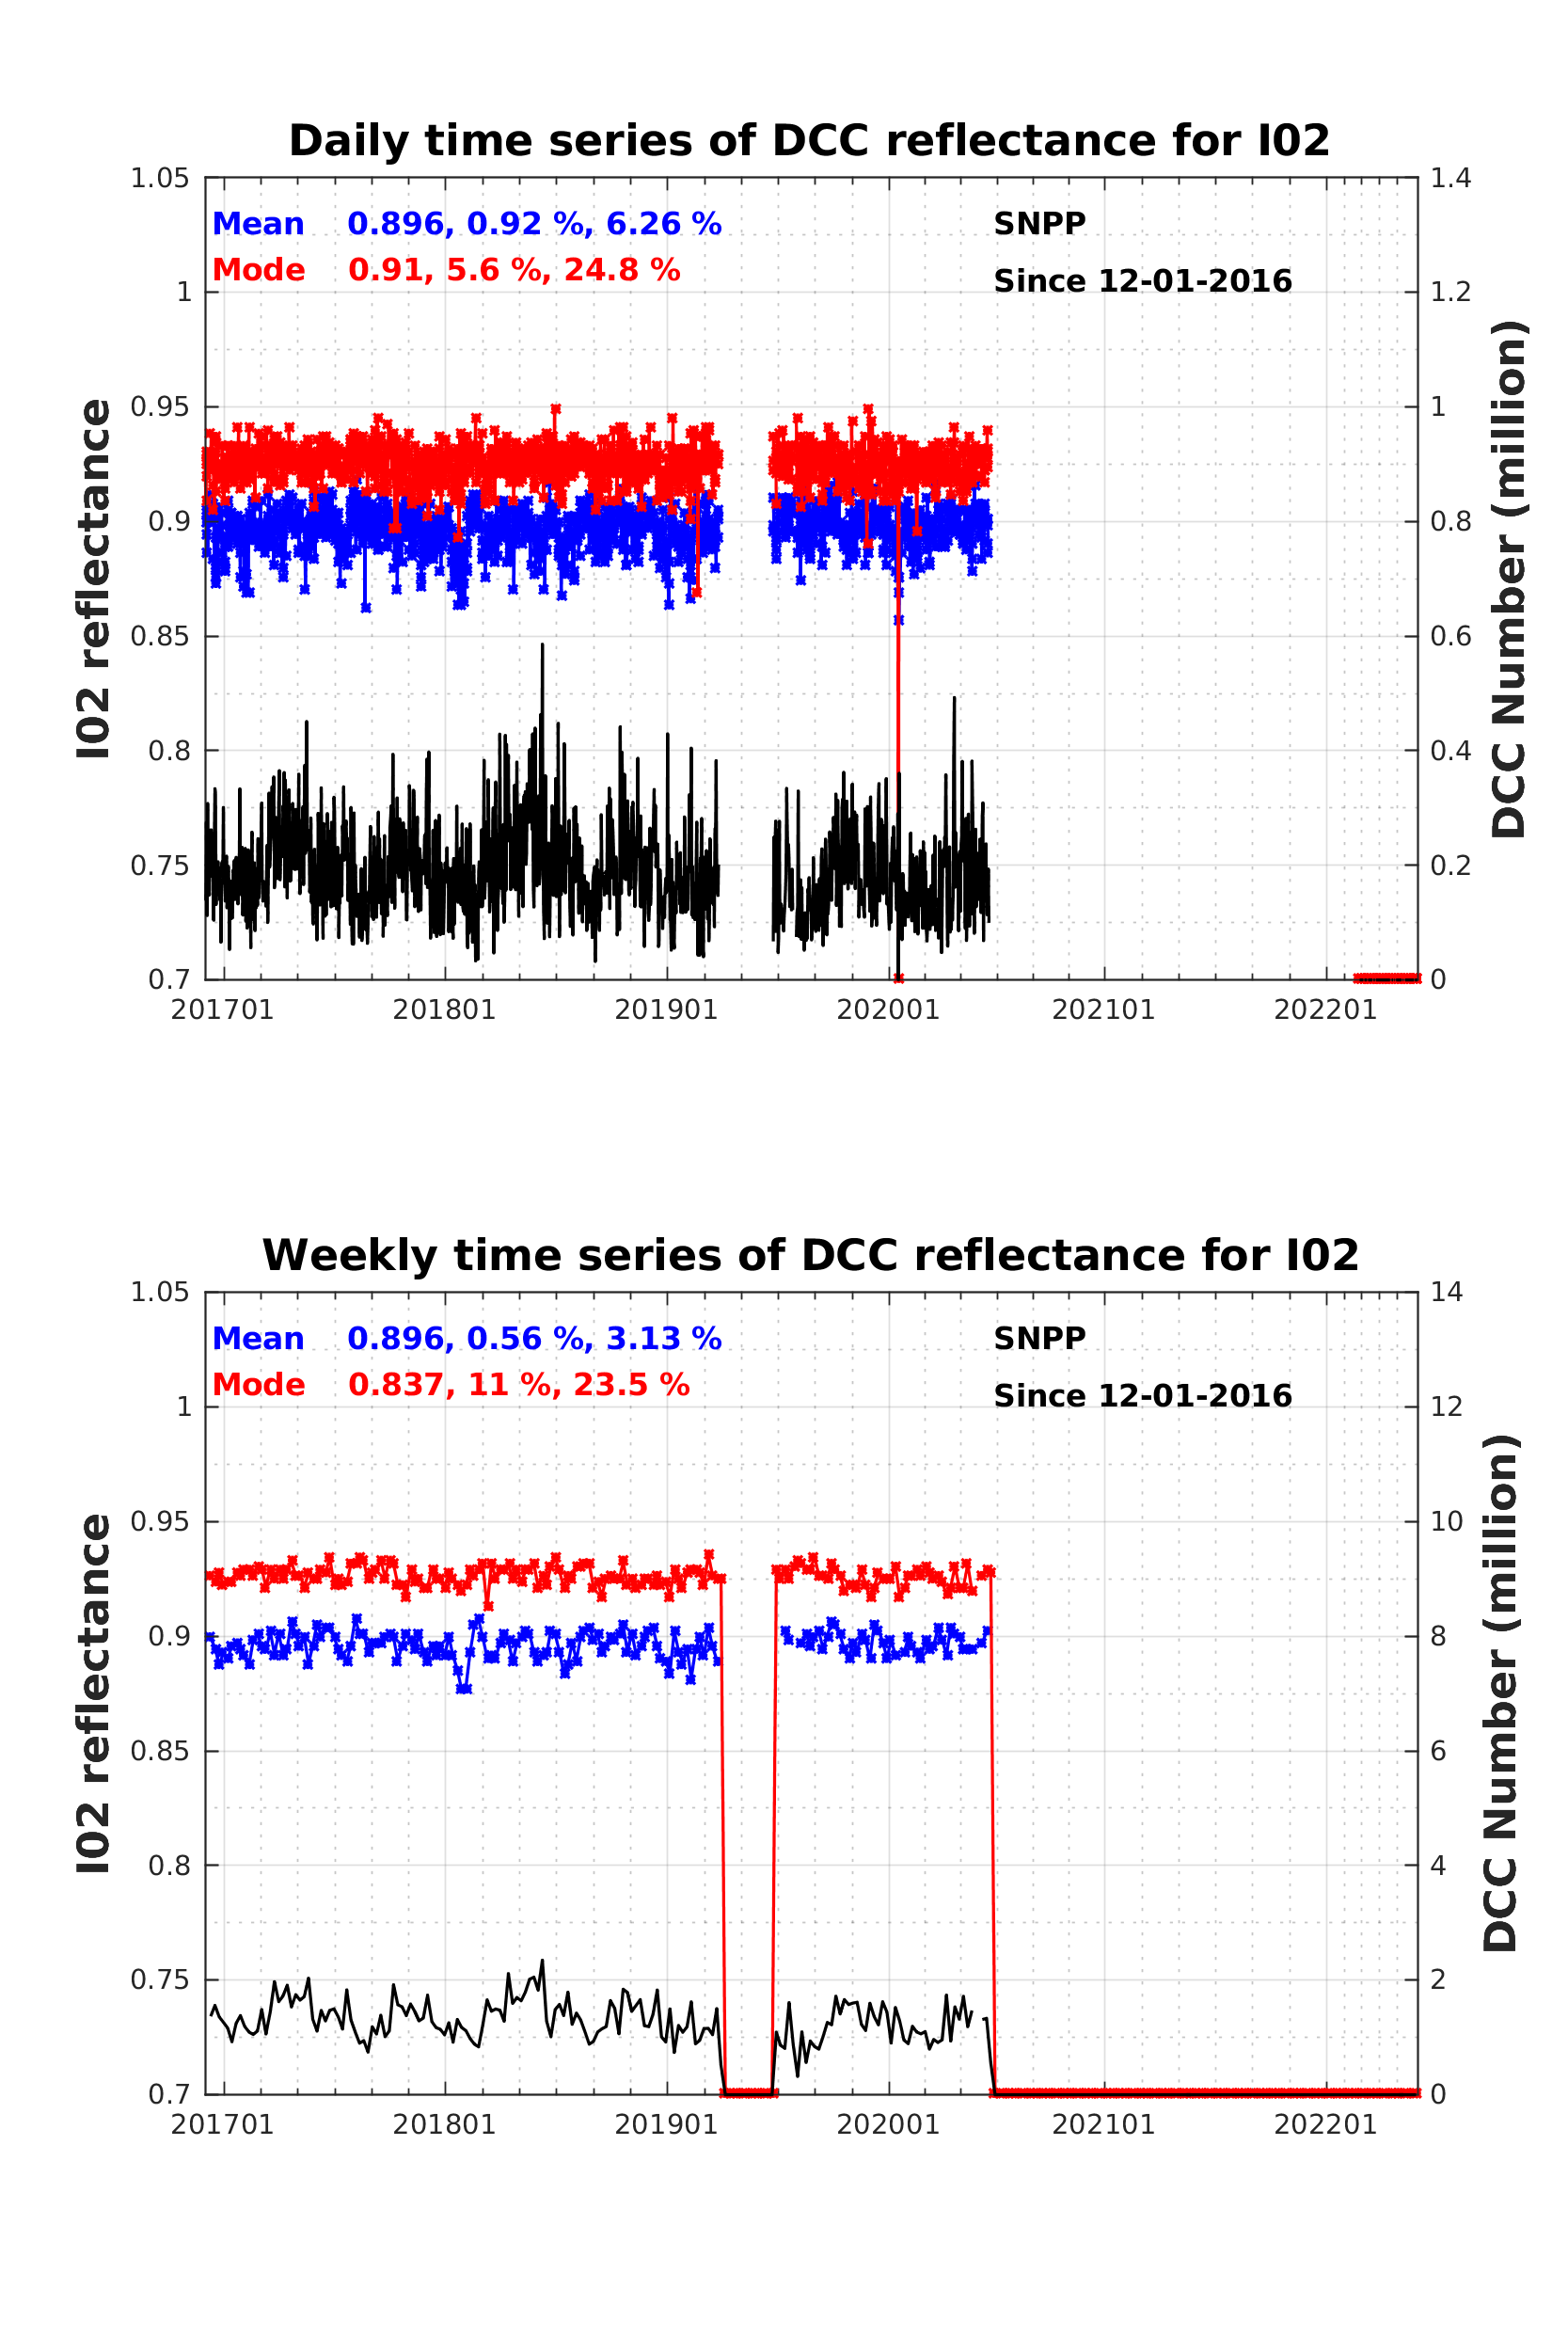
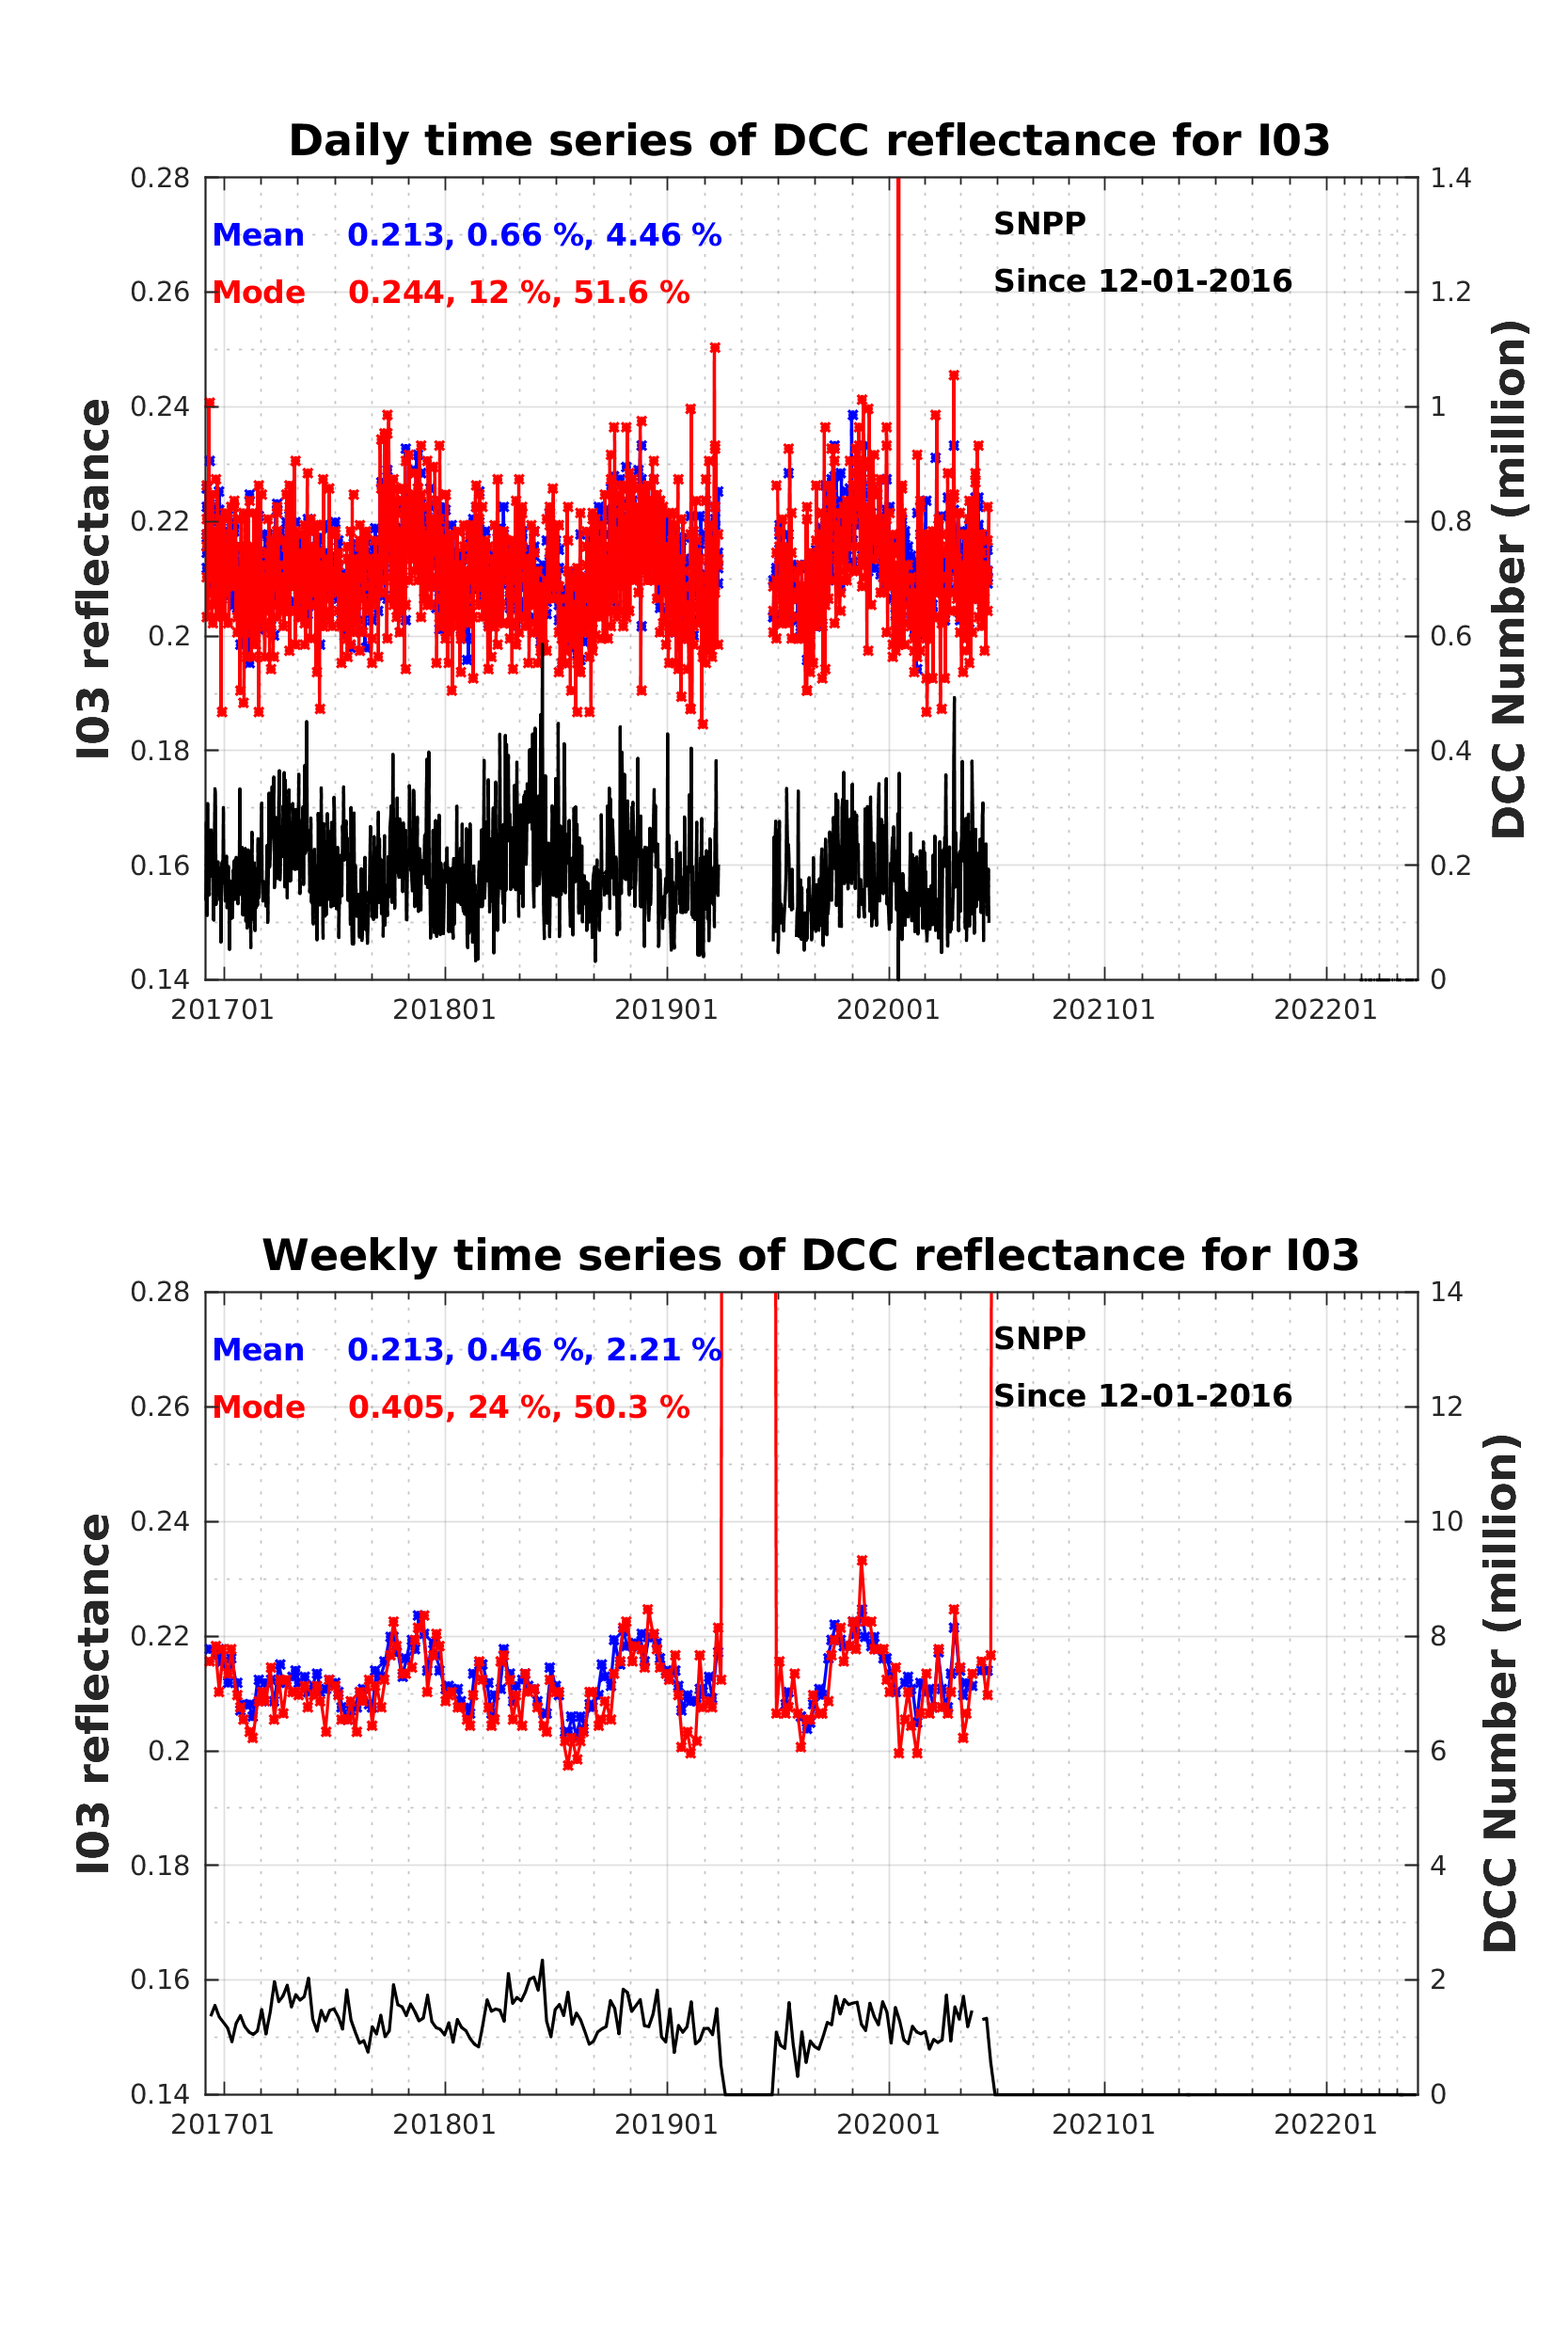
- Blue lines represent the mean reflectance value for DCC
- red lines represent the mode reflectance (the most frequent value)
- black lines represent sample size
- The three numbers are mean value, standard deviation, and range (max – min) of each line
-
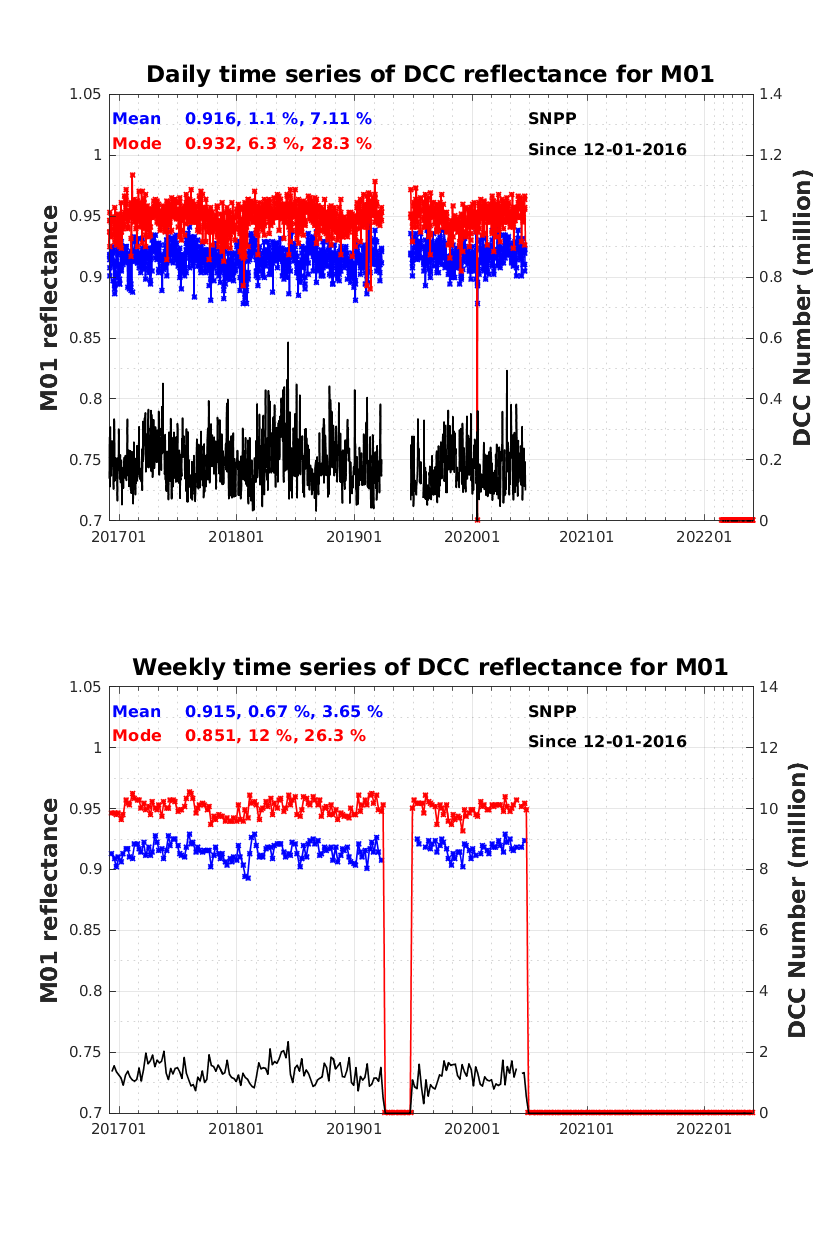
Time series of daily and weekly reflectance for M01
-
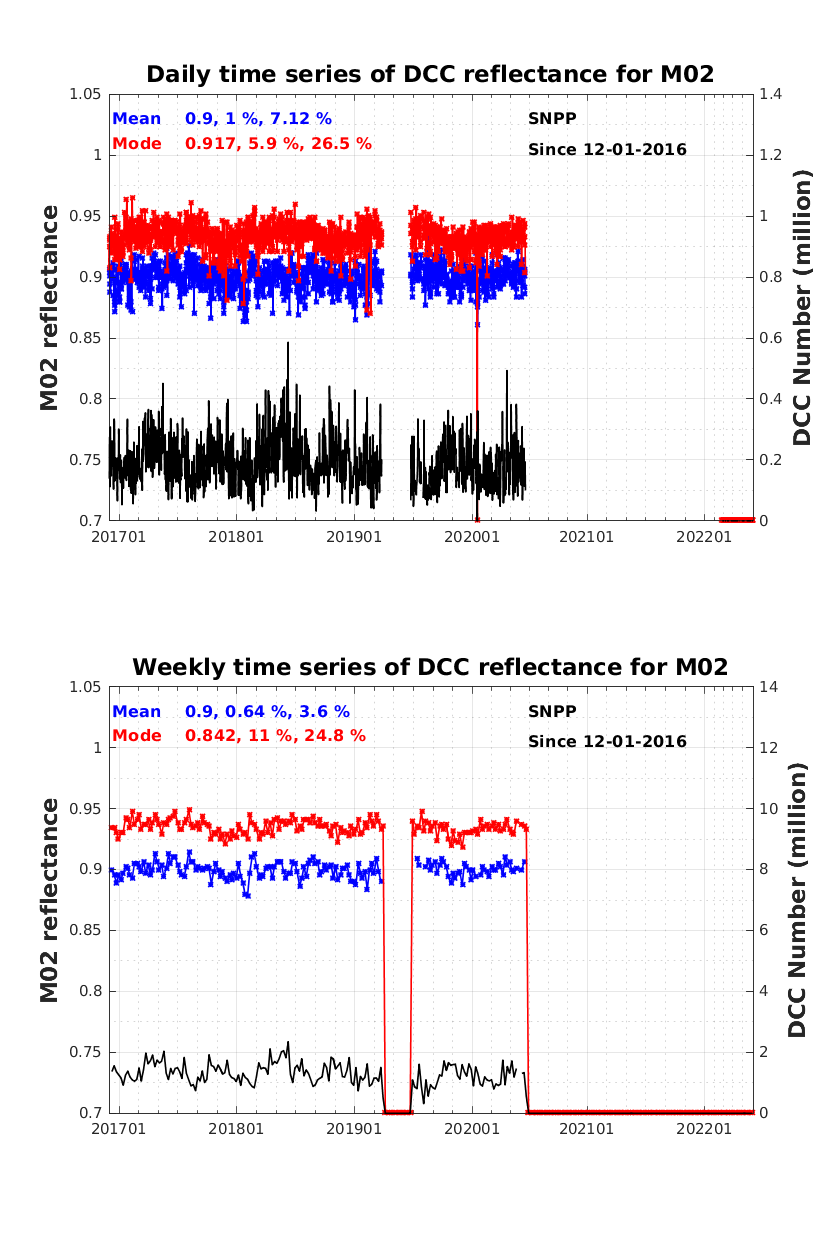
Time series of daily and weekly reflectance for M02
-
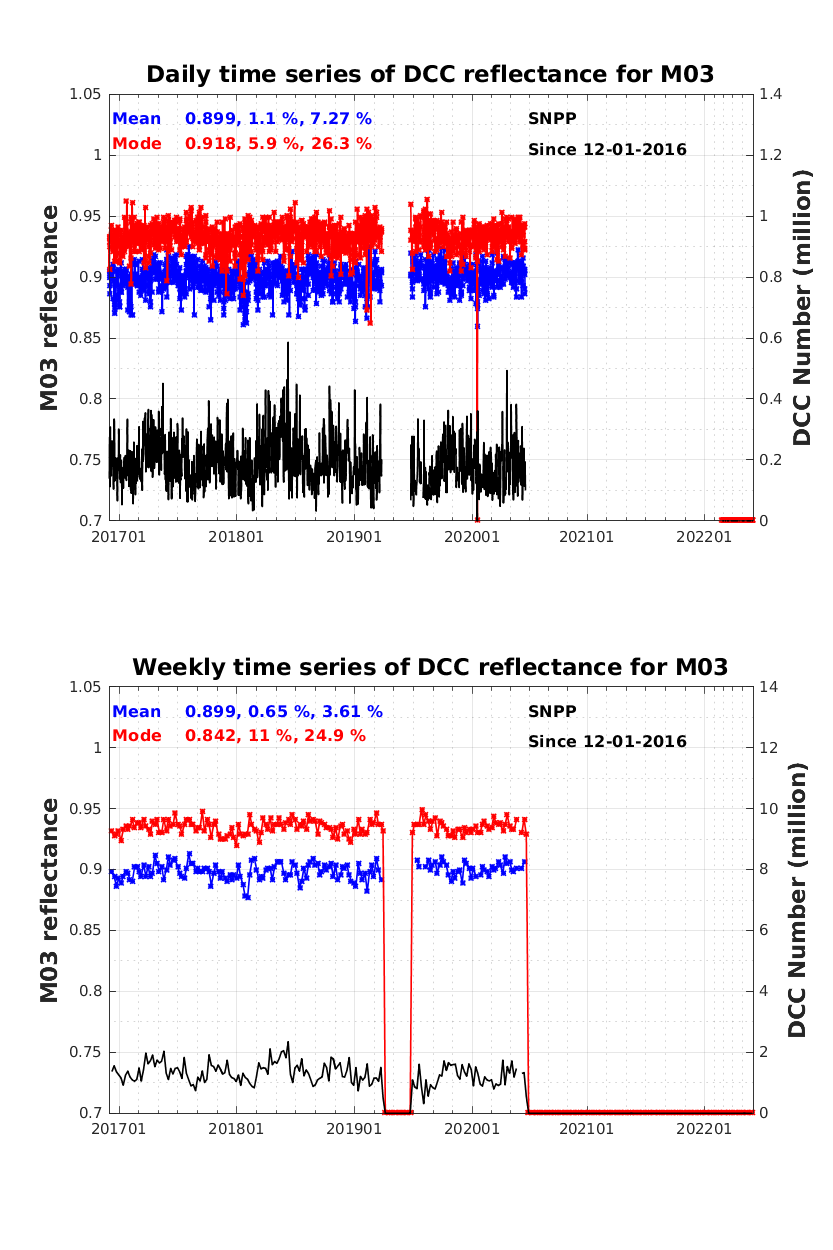
Time series of daily and weekly reflectance for M03
-
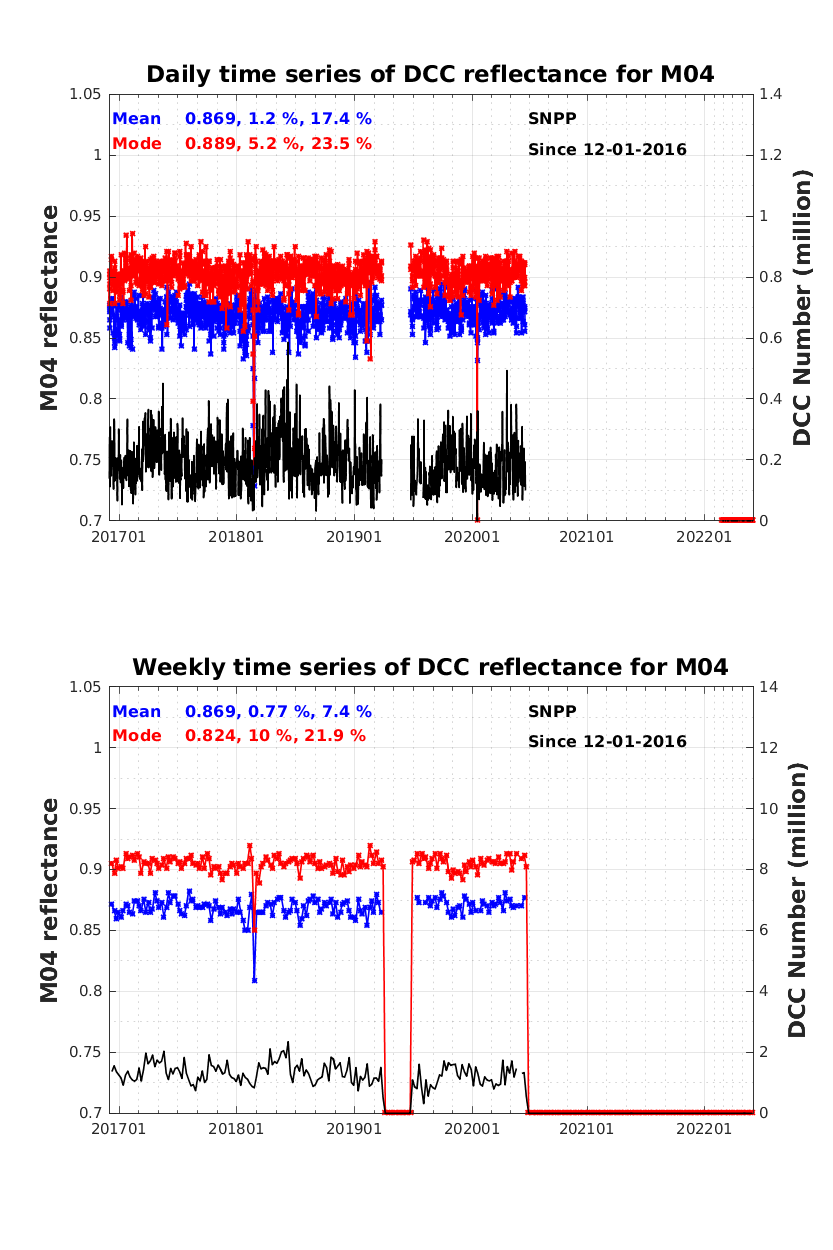
Time series of daily and weekly reflectance for M04
-

Time series of daily and weekly reflectance for M05
-

Time series of daily and weekly reflectance for M07
-
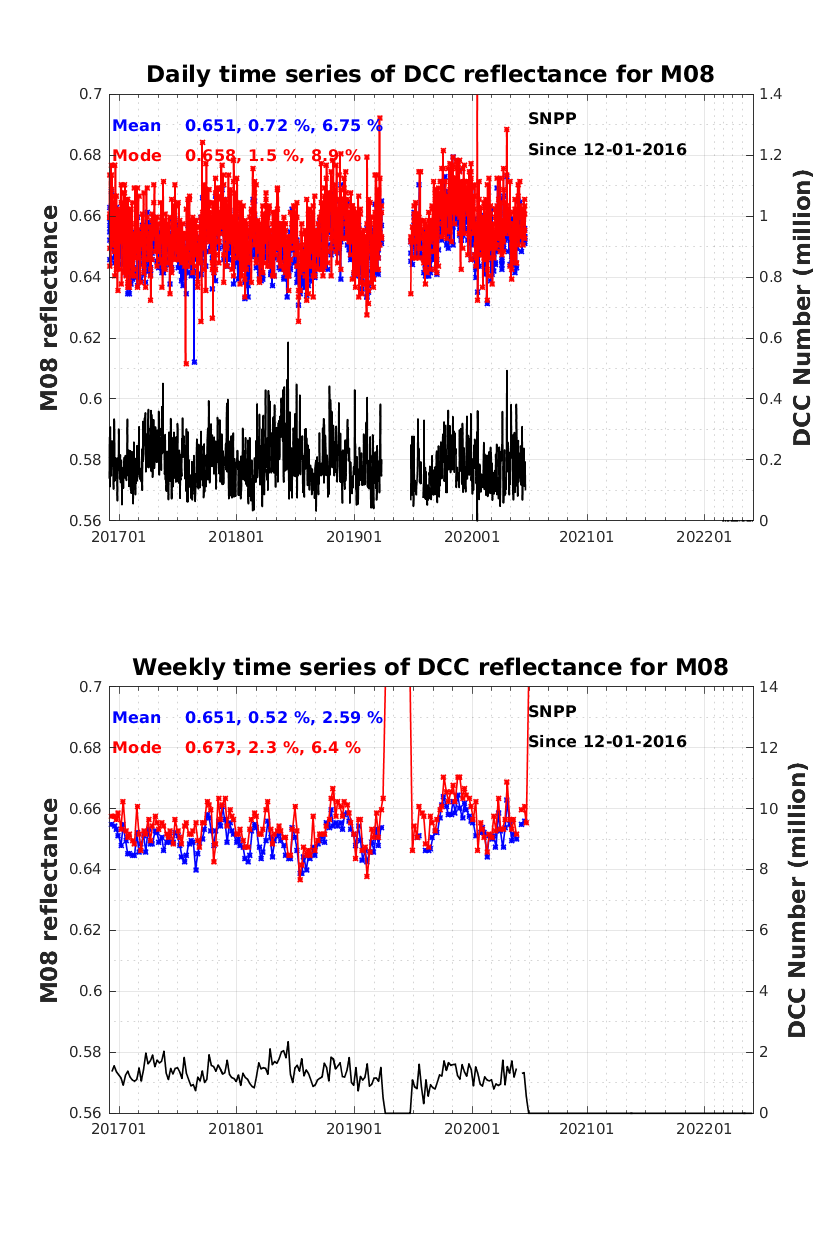
Time series of daily and weekly reflectance for M08
-
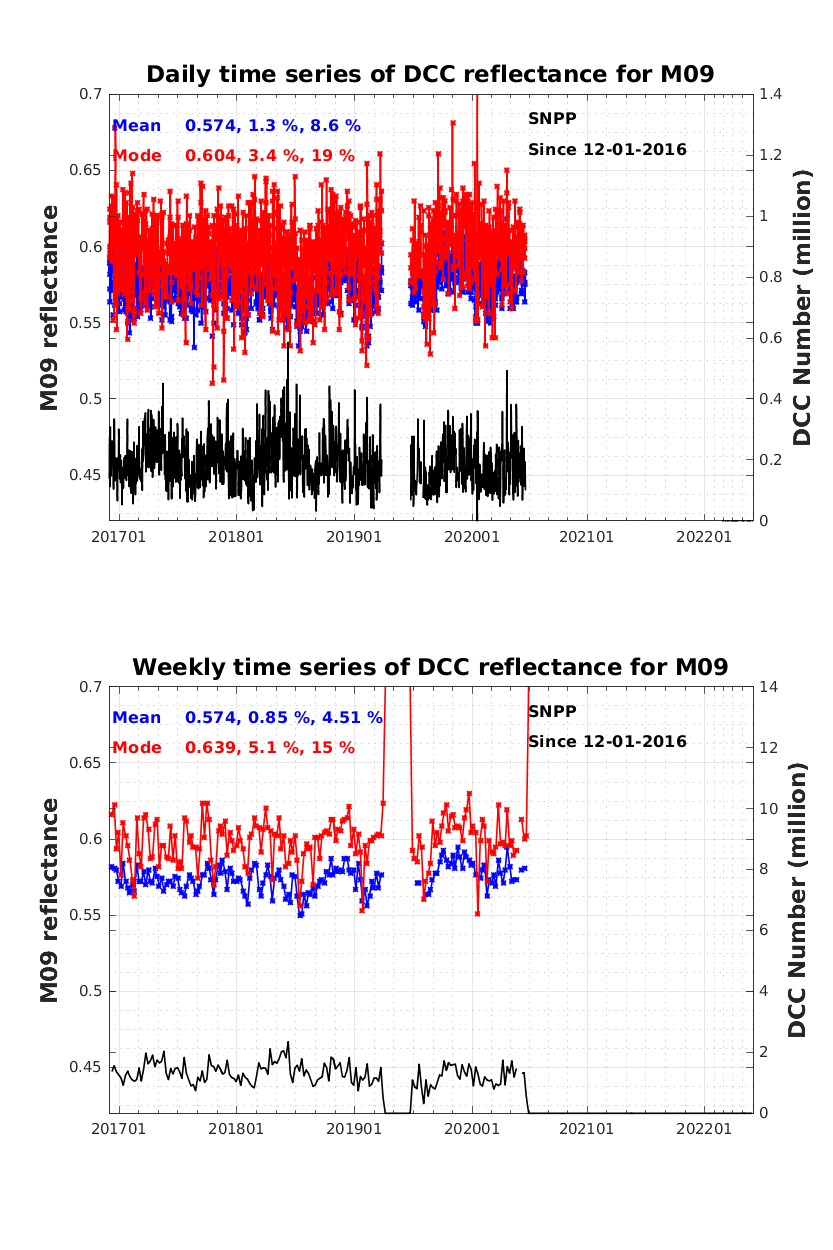
Time series of daily and weekly reflectance for M09
-

Time series of daily and weekly reflectance for M10
-
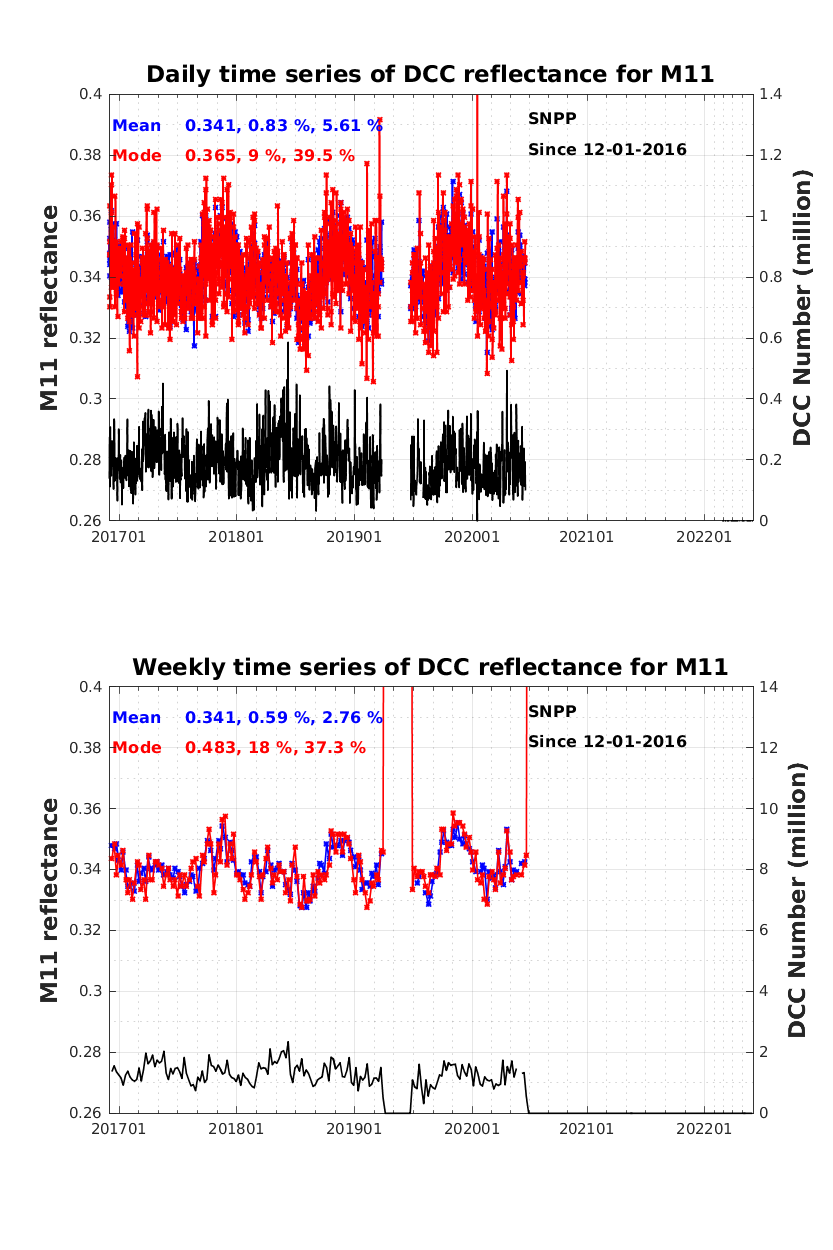
Time series of daily and weekly reflectance for M11
-
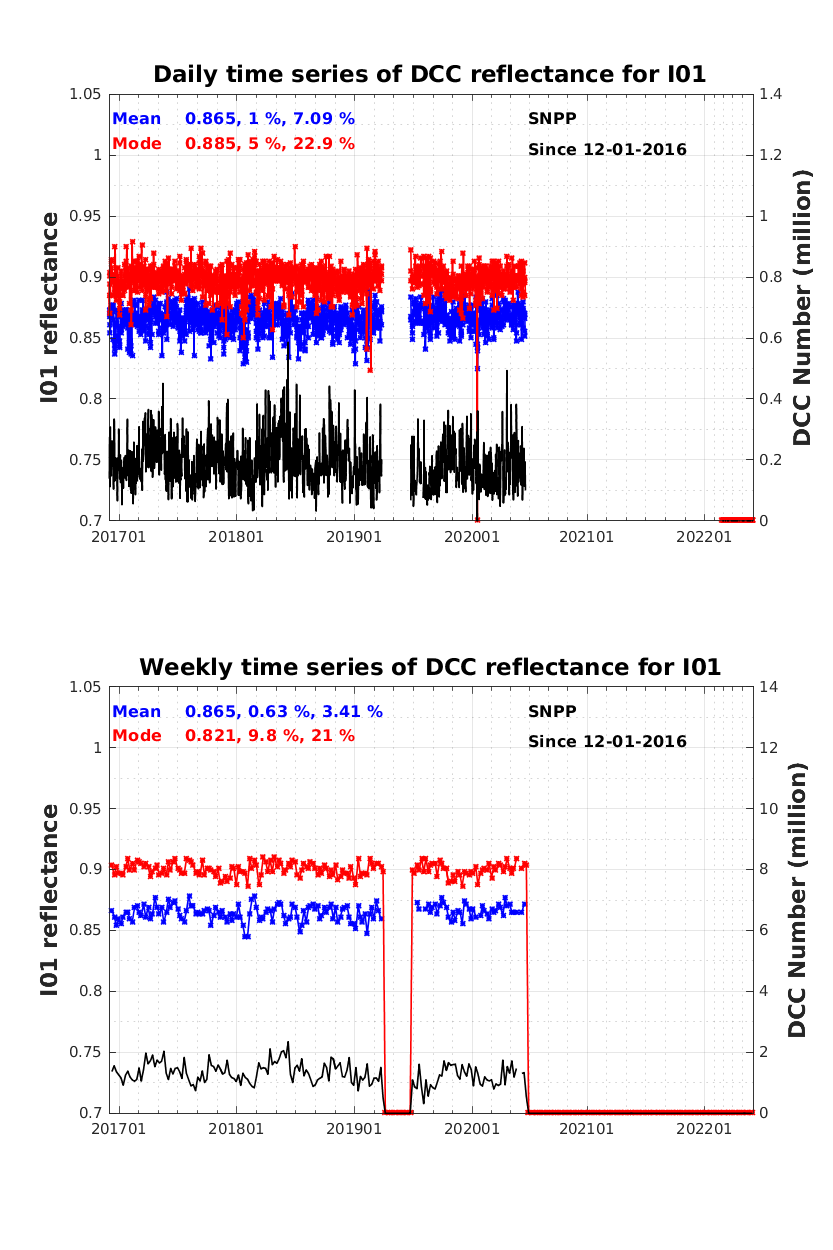
Time series of daily and weekly reflectance for I01
-

Time series of daily and weekly reflectance for I02
-
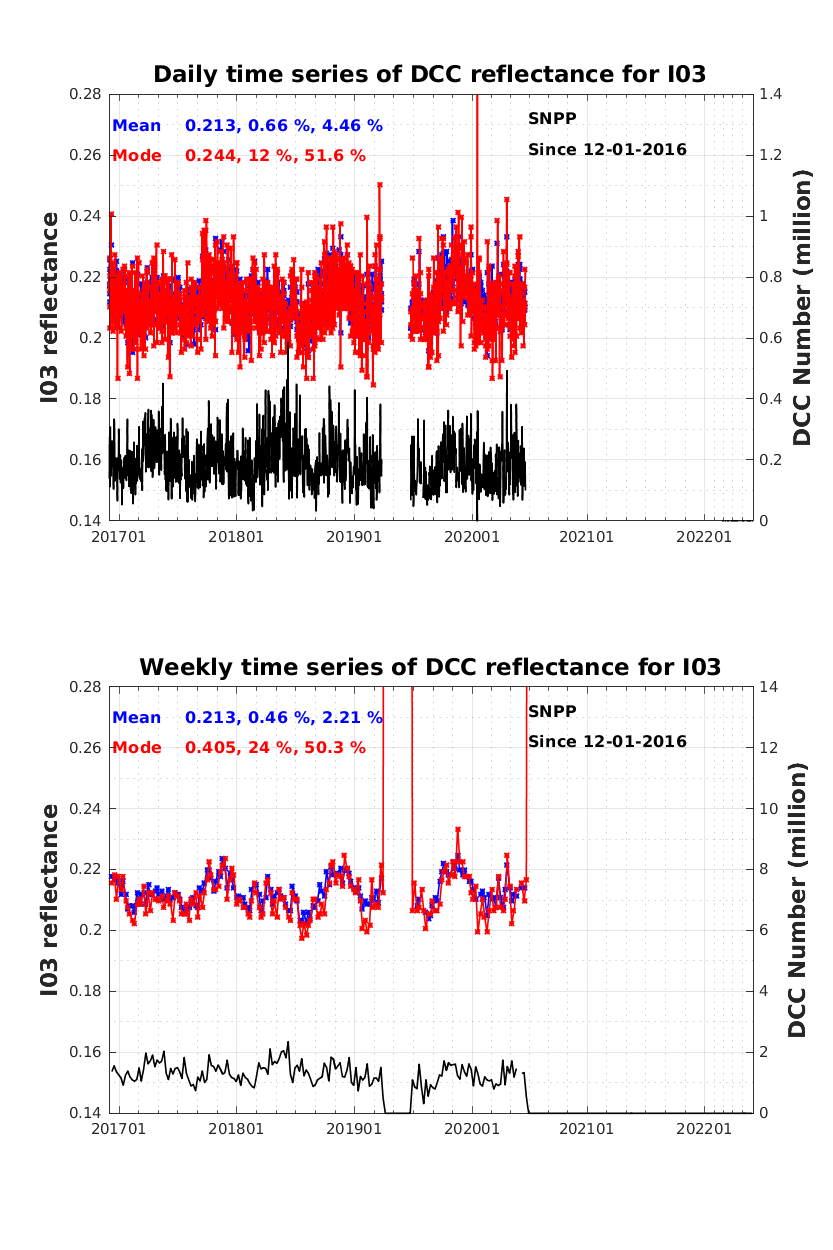
Time series of daily and weekly reflectance for I03