« Back to "Typhoon Bualoi - 21-24 October 2019"
Typhoon Bualoi on 21 October 2019
Posted: October 21, 2019
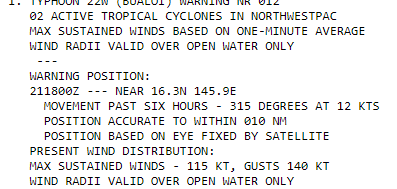
At 1500Z on 21 October, the Joint Typhoon Warning Center (JTWC) stated that Typhoon Bualoi had sustained winds of 105knts or ~120mph. This is the equivalent of a Category 3 storm in the Atlantic basin.
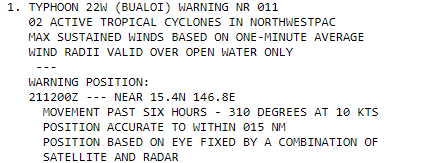
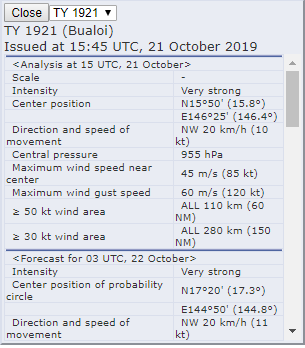
The Regional Specialized Meteorological Center (RSMC) Tokyo stated that the maximum winds at the center were 85knts (~95mph). The difference is due to differing methods of determining the winds and due to the fact that JTWC adopts a 1 min mean wind speed, but RSMC Tokyo adopts 10 mins mean wind speed.
As previously mentioned, while this doesn’t affect forecasts for this storm, this sort of difference in measurement could mean the difference between a tropical storm warning or a high wind warning.
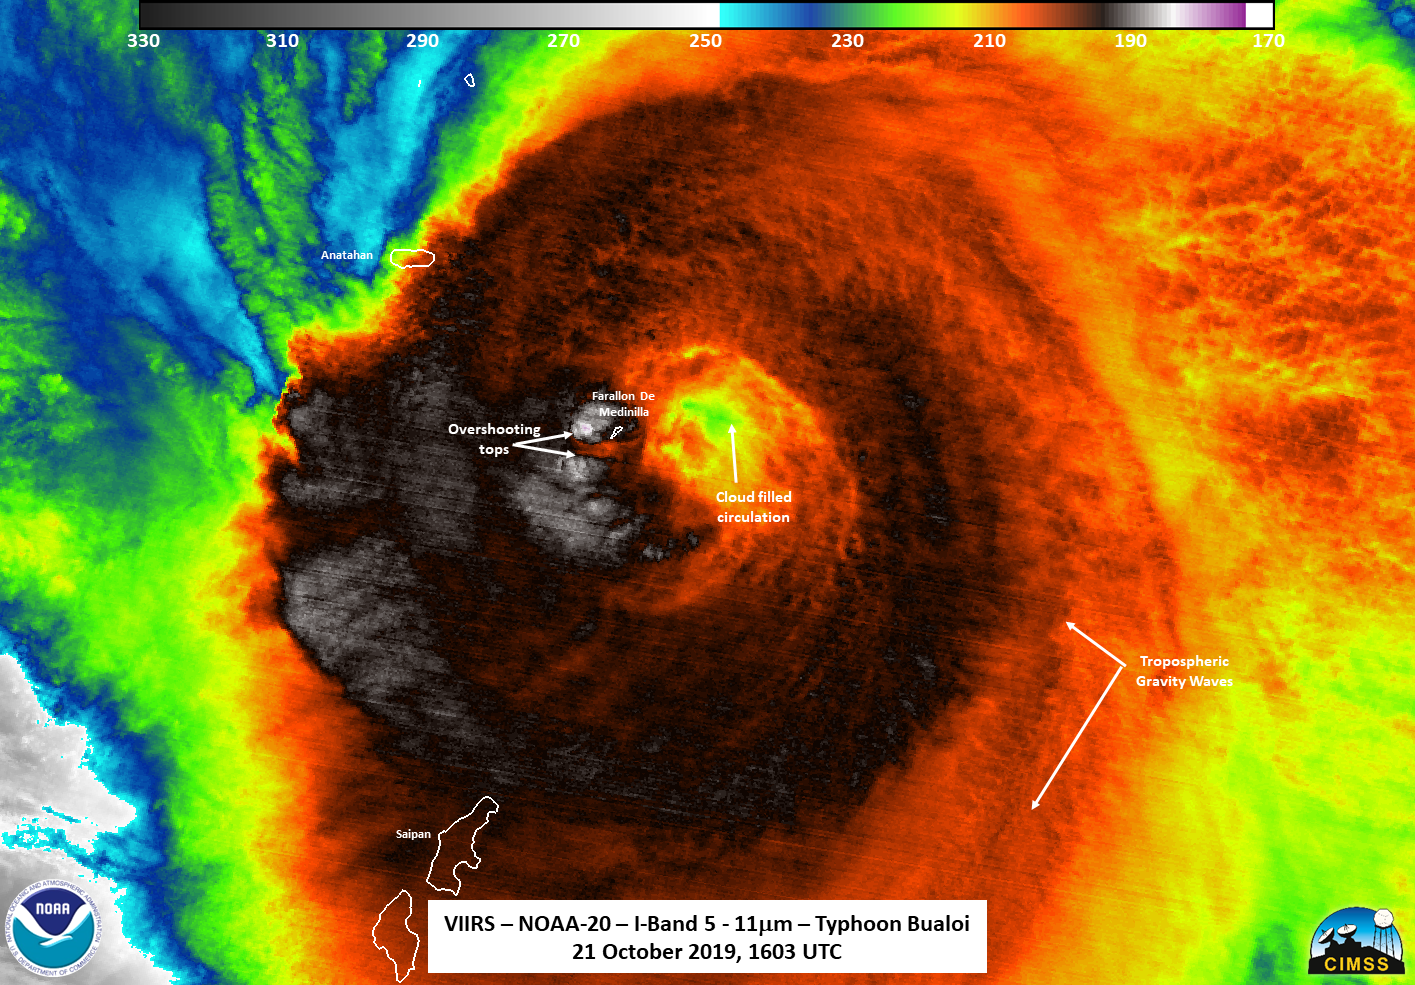
S-NPP first saw Typhoon Bualoi at ~1504Z on the far western edge of the pass. The last quarter moon (50% illumination) providing enough illumination to show the expanse of the eastern side of the storm. Because it was on the edge of the scan and the lunar geometry meant that there was only faint moonlight illuminating the storm as it approached the island of Anatahan. Several features could be seen in the imagery, including the fact that the storm had a cloud covered circulation as well as several overshooting tops, indicating that convection was continuing to build as S-NPP flew over.
In addition due to the fact that the storm was on the edge of the scan, the S-NPP imagery showed an oblong effect of the eye of the storm in the I05 (11μm) imagery due to parallax effects. However, even with those effects, one could see many features, such as overshooting tops and some tropospheric gravity waves.
NOAA-20 flew over Bualoi ~50 minutes later at ~1604Z very close to nadir. Due to the lunar geometry, the DNB imagery provided a much more illuminated scene of the storm, showing the wide range of convective feeder bands stretching to the northern Mariana Islands. In addition to the closed eye, one notable feature was that that the storm was not entirely symmetrical. This is further emphasized when comparing it to the I05 (11μm) imagery from NOAA-20, as seen below.
If one zooms in closer to the eye, one can see finer structures, such as the fact that the bulk of convection is more on the western edge of the eye than being symmetrical about the circulation, as seen in the DNB and I05 (11μm) below
Also of note is that as of the 1604 N20 pass, it appears that the center of circulation of Bualoi is just about to impact Farallon De Medinilla, which is the smallest island in the archipelago and used to be used by the US Navy for military and bombing exercises.
Interestingly, while circulation is somewhat easily seen in the I05 (11μm) and DNB imagery, its somewhat hard to tell what is going on within the storm, as seen in the ATMS 88.2GHz Brightness temperature, see below as compared to the I05 (11μm)
In addition, it is worth noting that the colder regions were not necessarily correlated with the inner core. While one could think this might be a sign of weakening, the MiRS surface rain rate product showed a well-developed circulation with a well-defined eye.

Unfortunately due to Bualoi being in between two GCOM-W1 passes meant that no microwave imagery was seen by the AMSR2 instrument. But while GCOM-W1 was out of position, there are other microwave sensors, such as the SSMIS-18 satellite. Unfortunately, the only imagery available was from 10 hours prior to the NOAA-20 pass. in that imagery, the SSMIS microwave imagery, shown below and is a screenshot from the CIMSS Tropical Cyclone website, of the 85 GHz brightness temperature from 0736Z on 21 October, sows a well-defined circulation.
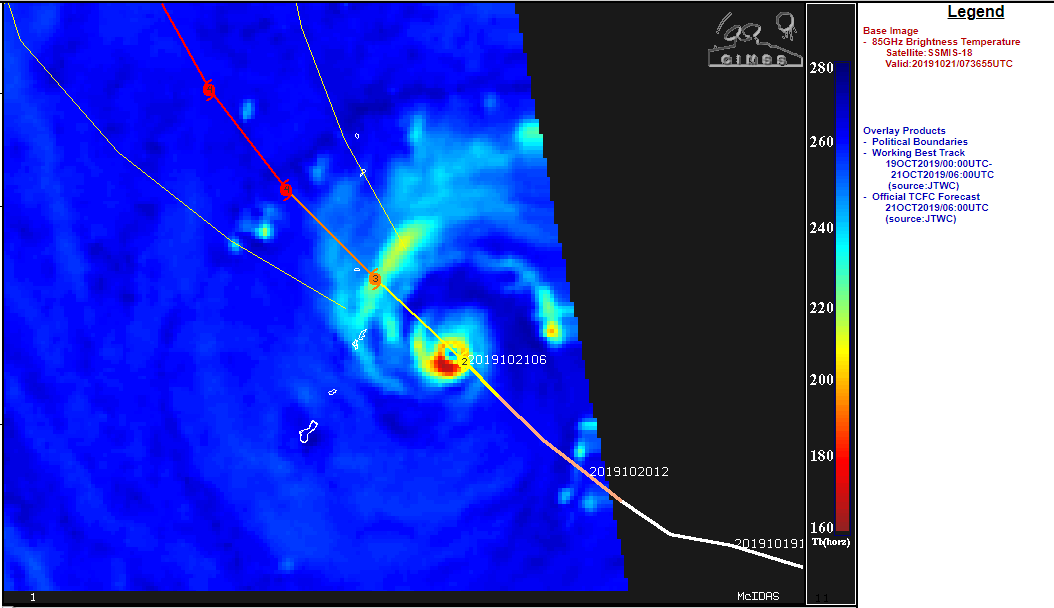
Imagery courtesy of the CIMSS Tropical Cyclone website.
While S-NPP has severe parallax effects, it is always worth looking at the comparison between satellites to see any changes in the storm. Interestingly the overall shape of the storm did not change much between the successive passes, as seen in the I05 (11μm) imagery, seen below
Though the storm obviously rotated between passes. In addition, one could say that the convection around the eye became a little more filled in, perhaps an indication of the storm strengthening. In addition, the DNB imagery also seemed to show a little more symmetrical storm between the earlier NPP and later N20 pass as well as the eye somewhat clearing out
Both of these would indicate a possible strengthening of the storm. Utilizing this, along with geostationary imagery suggest would suggest that the storm was strengthening at the time. This is something that the 15Z forecast from the JTWC says would happen. As seen below, the Joint Typhoon Warning Center predicted that Bualoi strengthen from 105knts at 15Z to 115kts by 00Z, which is indeed what happened

As it turns out, that is exactly what happened. The 21Z report from the Joint Typhoon Warning Center (JTWC) stated that Typhoon Bualoi had sustained winds had increased to 115knts or ~132mph, making it equivalent to a Category 4 storm in the Atlantic basin.
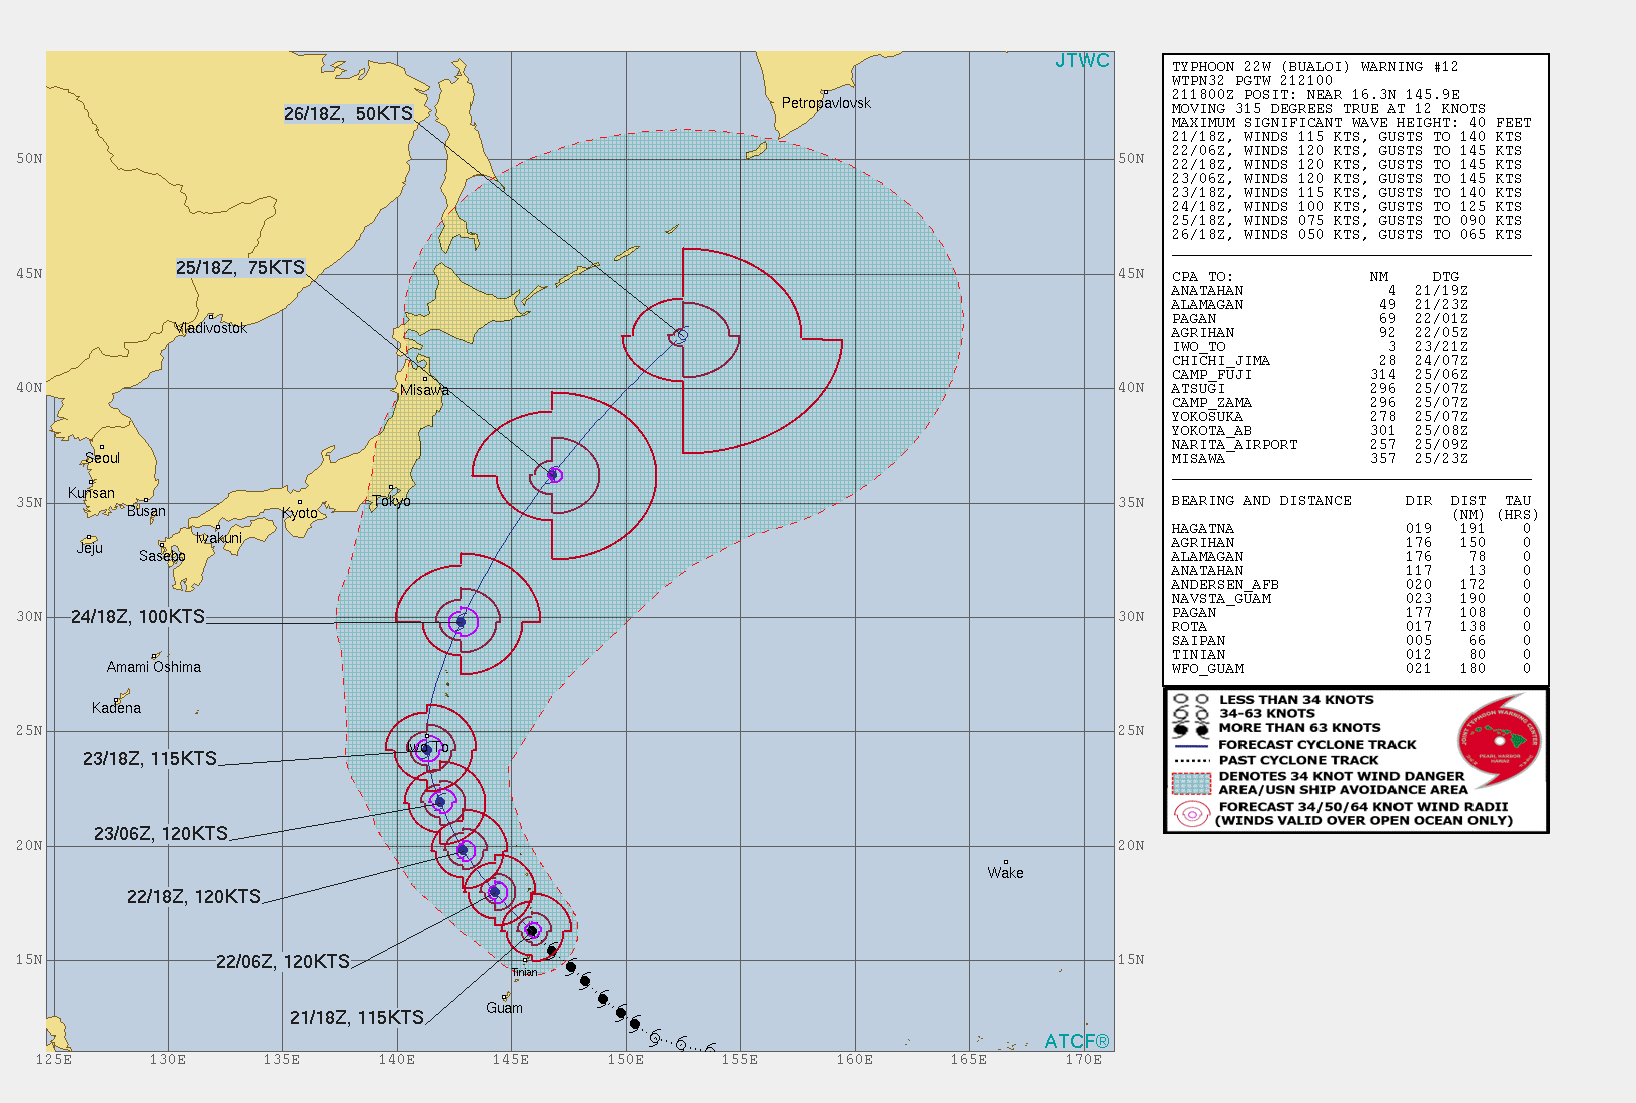
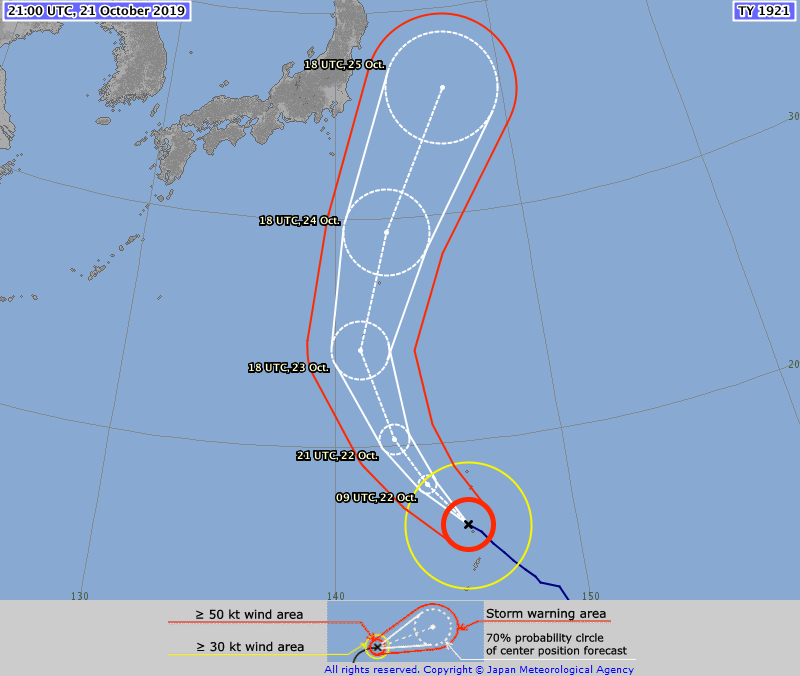
Bualoi is expected to remain a strong tropical cyclone over the next day and intensify slightly as it continues to make the turn to the north, moving well east of Japan, per the Joint Typhoon Warning Center forecast and JMA, both in fairly good agreement on the rough timing and direction of the storm.
It is also worth noting that at the request of FEMA, an initial look at the CNMI region showed no power outages on Guam or Rota. A quick check of Guam and Rota showed power still on those islands. However, Saipan and Tinian were under clouds, meaning that no real analysis could be done in those areas.