« Back to "Flooding from Imelda - September 19-22 2019"
Flooding from Tropical Depression Imelda seen on 20 and 21 September 2019
Posted: September 21, 2019
Over the last several days, Tropical Depression Imelda brought widespread flooding to southeast Texas. As can be seen in the image below taken from the NWS Forecast Office in Houston/Galveston, TX, the area south of Beaumont, TX received the bulk of the rain from Imelda
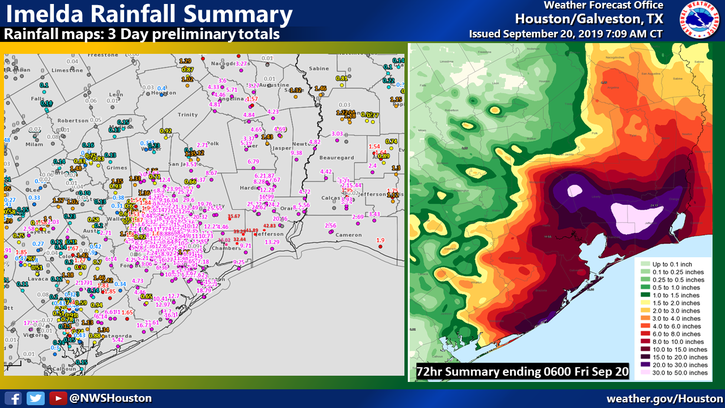
Image taken from NWS WFO Houston on 21 September 2019 at 4pm CDT
Imelda posted a record daily rainfall in Houston of 9.8″, according to the National Weather Service. As the screenshot below from the NWS Advanced Hydrological Predictive Service, the rivers in the Beaumont area continued to be at record levels on 21 September, as the rain drained out of various rivers.
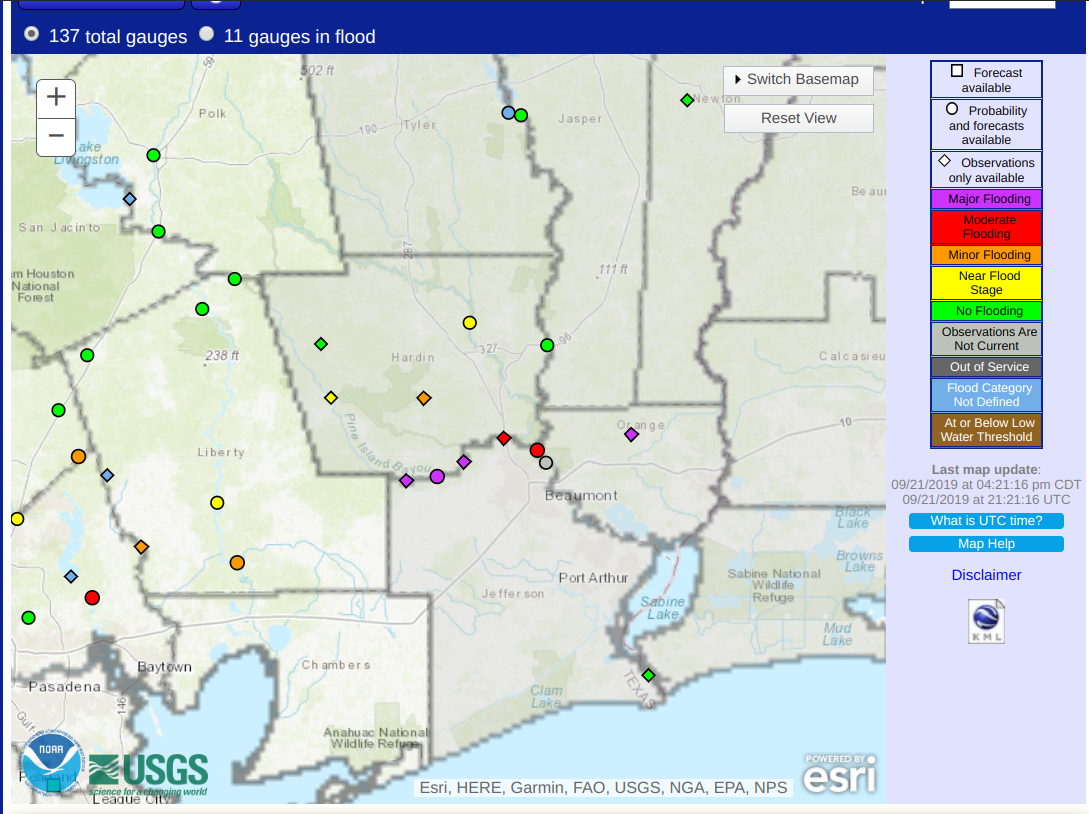
Image taken from NWS Advanced Hydrological Predictive Service for Houston on 21 September 2019 at 4:24pm CDT
As can be seen in the VIIRS Flood Map product using data from the Direct Broadcast antenna on 21 September 2019, as displayed in Real Earth, one can clearly see the flooding in the same area. The usage of the direct broadcast antenna at the University of Wisconsin allows for such products to be produced and disseminated to users in a timely manner.
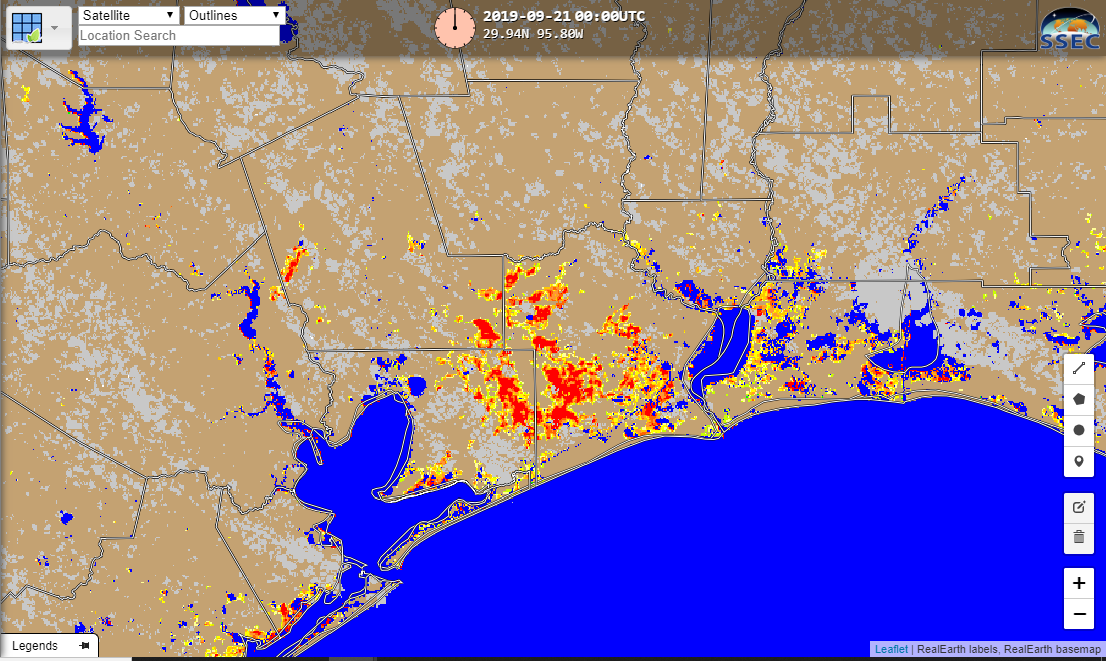
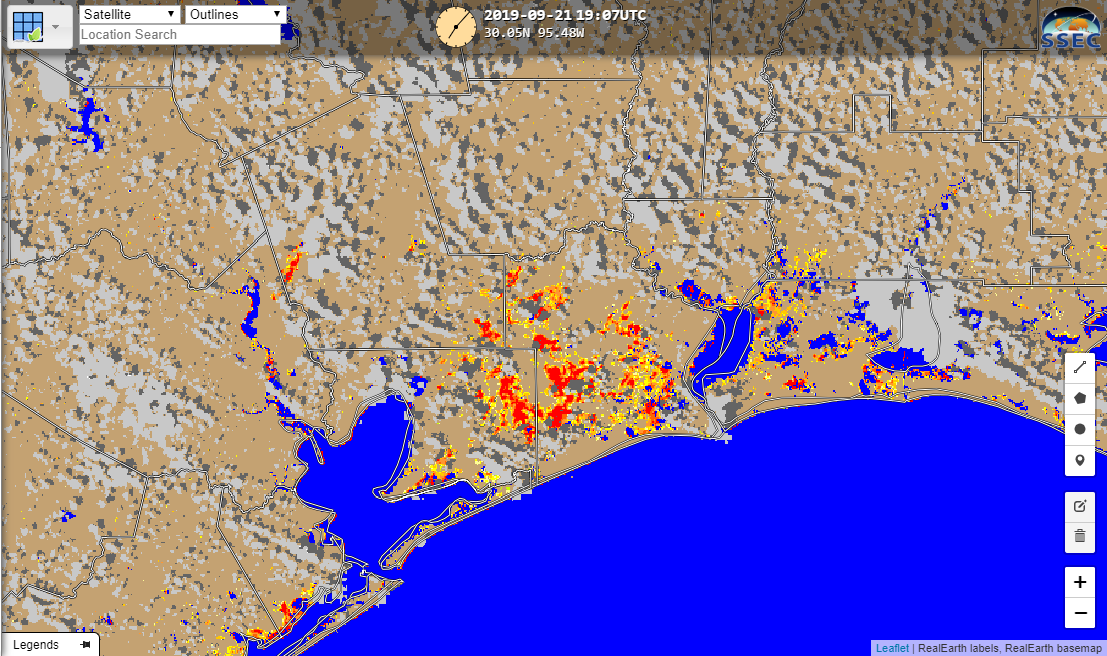
Image taken from Real Earth on 21 September 2019 at 4:25pm CDT
The daily VIIRS Flood product, along with the daily composite from the ABI instrument can blended together for a combined daily flood detection from VIIRS and ABI . Basically it is based on the VIIRS 375-m daily composited flood maps, and uses the 1-km ABI daily clear-sky detection results to fill the gaps of clouds and cloud shadows in the VIIRS maps. If the VIIRS data is not available, the joint product is simply the daily, clear sky, composite of the 1-km ABI results.
On 20 September 2019, both VIIRS passes over the area were both cloudy as seen below in the daily VIIRS composite:
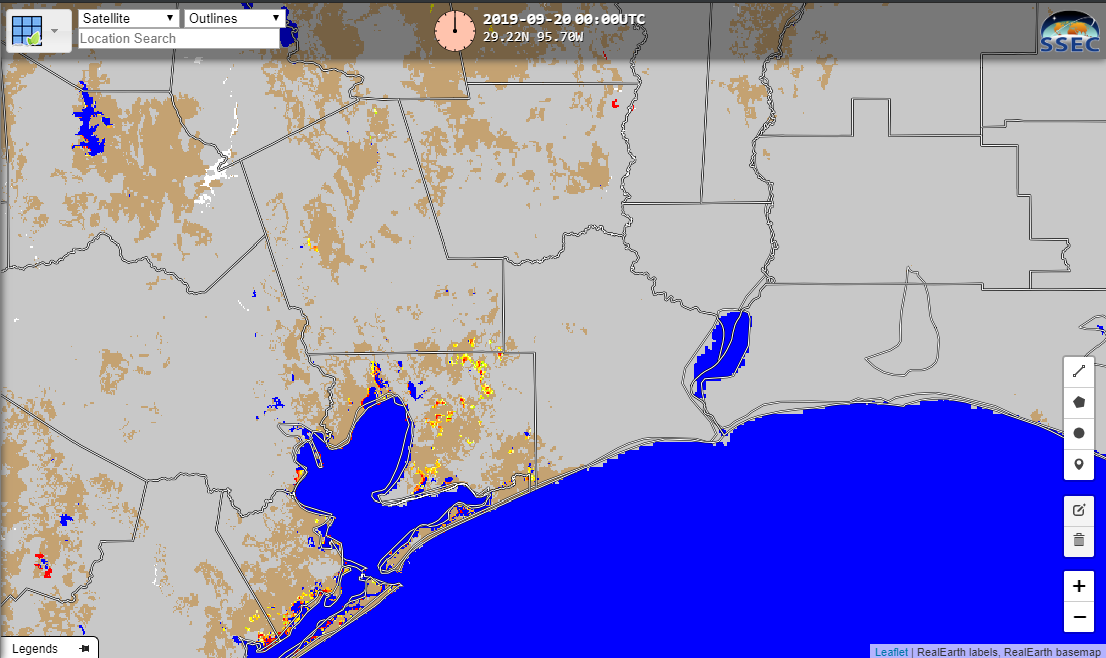
Image taken from Real Earth on 21 September 2019 at 5:405pm CDT
This meant that the Joint ABI/VIIRS product from 20 September 2019, shown below, primarily consisted of information from the clear sky ABI composite. However, as can be seen below, there were still areas of flooding that could be seen
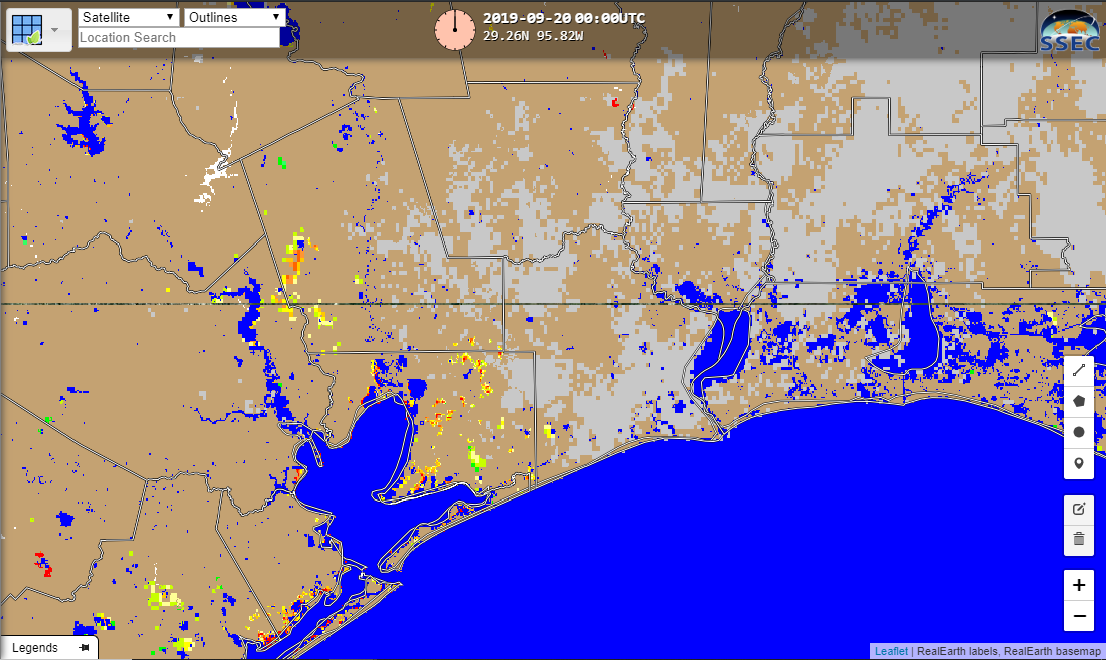
Image taken from Real Earth on 21 September 2019 at 5:405pm CDT
The VIIRS imagery from both of the passes around 19Z on 21 September was relatively clear, as shown below
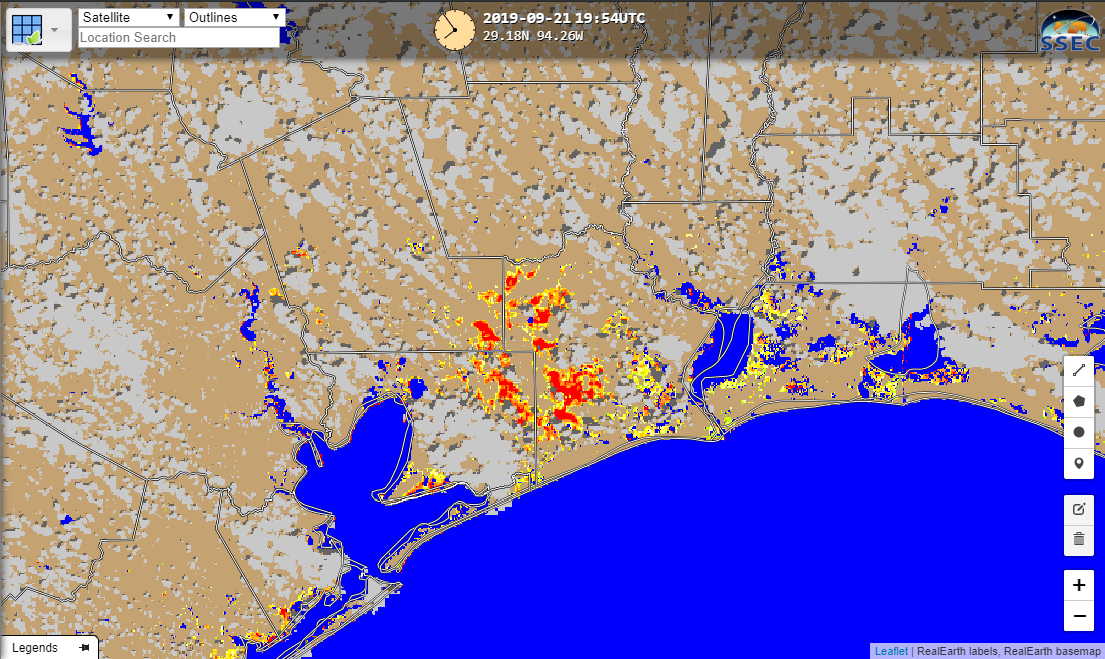
Image taken from Real Earth on 21 September 2019 at 4:25pm CDT
By doing a composite of all of the VIIRS passes for a single day, one can create a daily composite of the region, show below
Image taken from Real Earth on 22 September 2019 at 6:05am CDT
Using this, along with the daily ABI cloud-free flood map composite, is used to create the Joint ABI/VIIRS flood product, which is also available on Real Earth and is updated every day at ~0800 UTC. The image below shows the resulting Joint Product from 21 September 2019
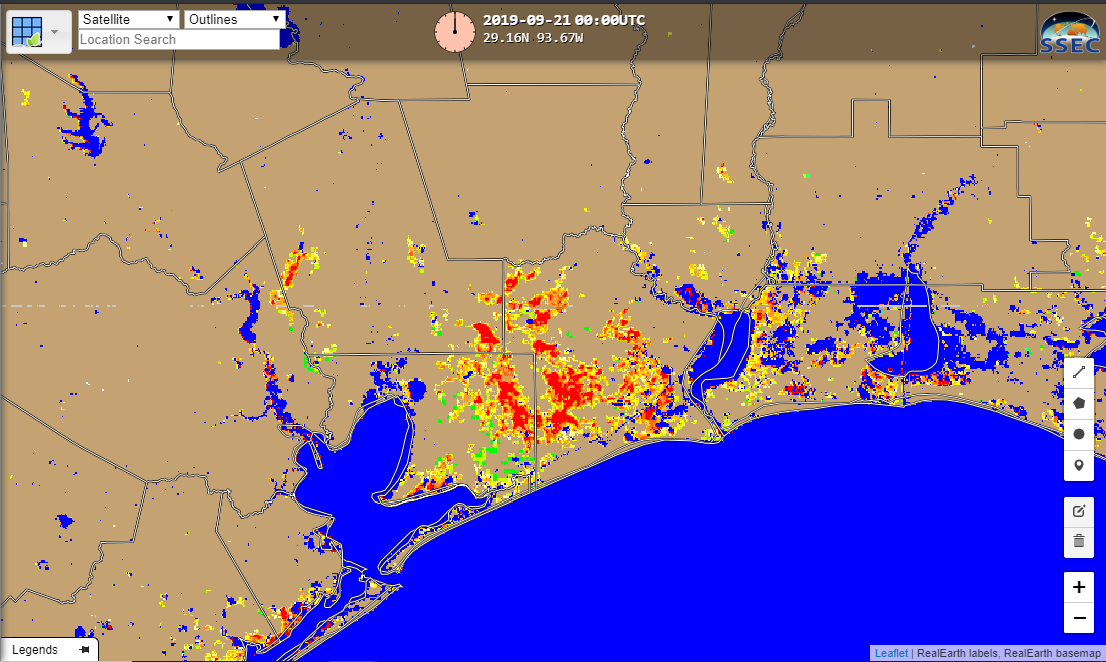
Image taken from Real Earth on 22 September 2019 at 6:05am CDT
While there was no corresponding Sentinel pass to compare to for both the 20 and 21 Sept cases owing to the 12-day operational repeat of Sentinel-1, these areas are consistent with imagery observed on 19 September 2019, as discussed in this previous post.
Information on the VIIRS LEO/GEO product, as well as a quick guide on the products available, can be found at the NOAA Satellite Proving Ground Global Flood Website