« Back to "Typhoon Bualoi - 21-24 October 2019"
Typhoon Bualoi on 23 October 2019
Posted: October 23, 2019
At 1500Z on 22 October, the Joint Typhoon Warning Center (JTWC) stated that Typhoon Bualoi had sustained winds of 100knts or ~115mph, making it equivalent to a Category 3 storm in the Atlantic basin.
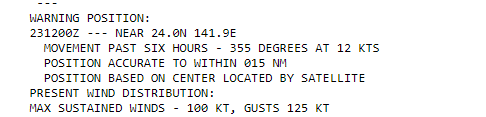
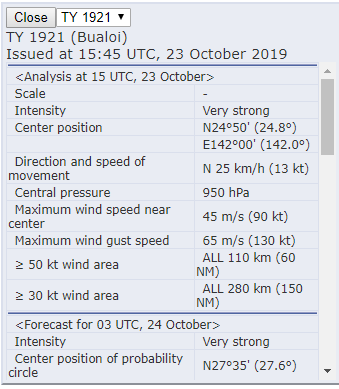
The Regional Specialized Meteorological Center (RSMC) Tokyo stated that the maximum winds at the center were 90knts (~103mph). The difference is due to differing methods of determining the winds and due to the fact that JTWC adopts a 1 min mean wind speed, but RSMC Tokyo adopts 10 mins mean wind speed.
Prior to the passes of Suomi-NPP (S-NPP) and GCOM-W1 and NOAA20, the Global Precipitation Measurement (GPM) Microwave Imager (GMI) flew over Typhoon Bualoi at ~1516Z from 23 October 2019, providing an inside look at the storm, as seen in the screenshot from the CIMSS Tropical Cyclone website
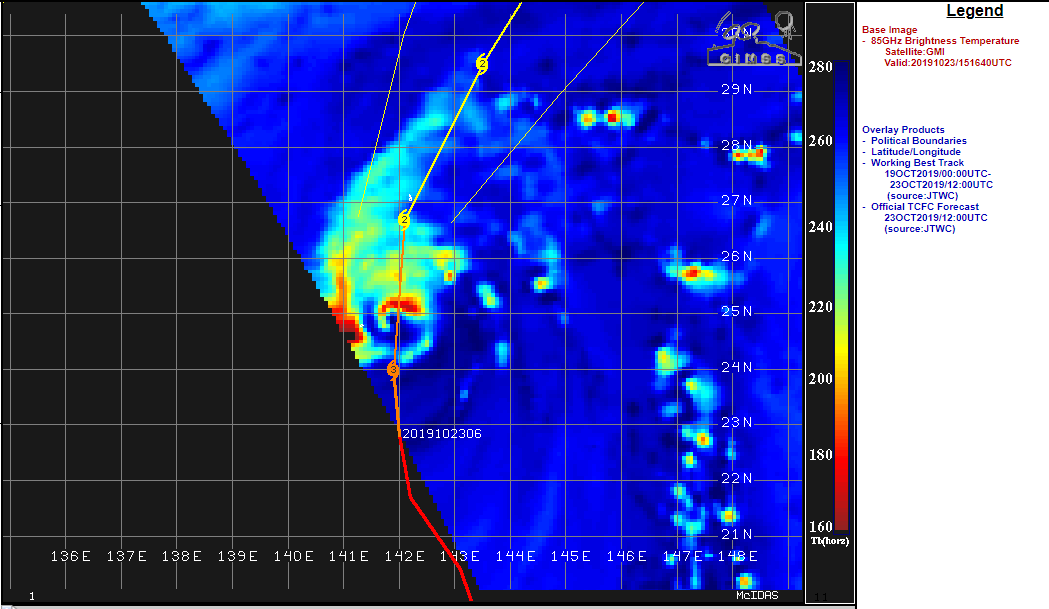
Image courtesy of the CIMSS Tropical Cyclone website
While on the edge of the scan, the 85 GHz brightness temperature showed that the circulation of Bualoi was not completely surrounded by convection. In fact, there are areas where there is clear air creeping into the convection, an indication of possible weakening.
The next satellite to see Bualoi was NOAA-20 a few minutes later at ~1522Z on the eastern side of the pass. Being on the edge of the pass meant that features were a bit oblong and distorted due to parallax effects. In addition, it meant that the Day Night Band features hidden as compared to near-nadir passes. This is because of the so-called “Venetian blind” effect, as seen below.

While a general sense of where the clouds were located could be seen, most of the detail, even with illumination from airglow, was lost. The I05 (11μm) brightness temperature, while deeply affected by parallax effects, clearly showed large amounts of convection to one side of the storm and was drastically different in appearance than yesterday, losing its symmetrical appearance. This is something that is also reflected as shown in the GMI imagery from a few minutes prior to the NOAA-20 overpass. Other features included some tropospheric gravity waves, which you would expect from a large area of convection.
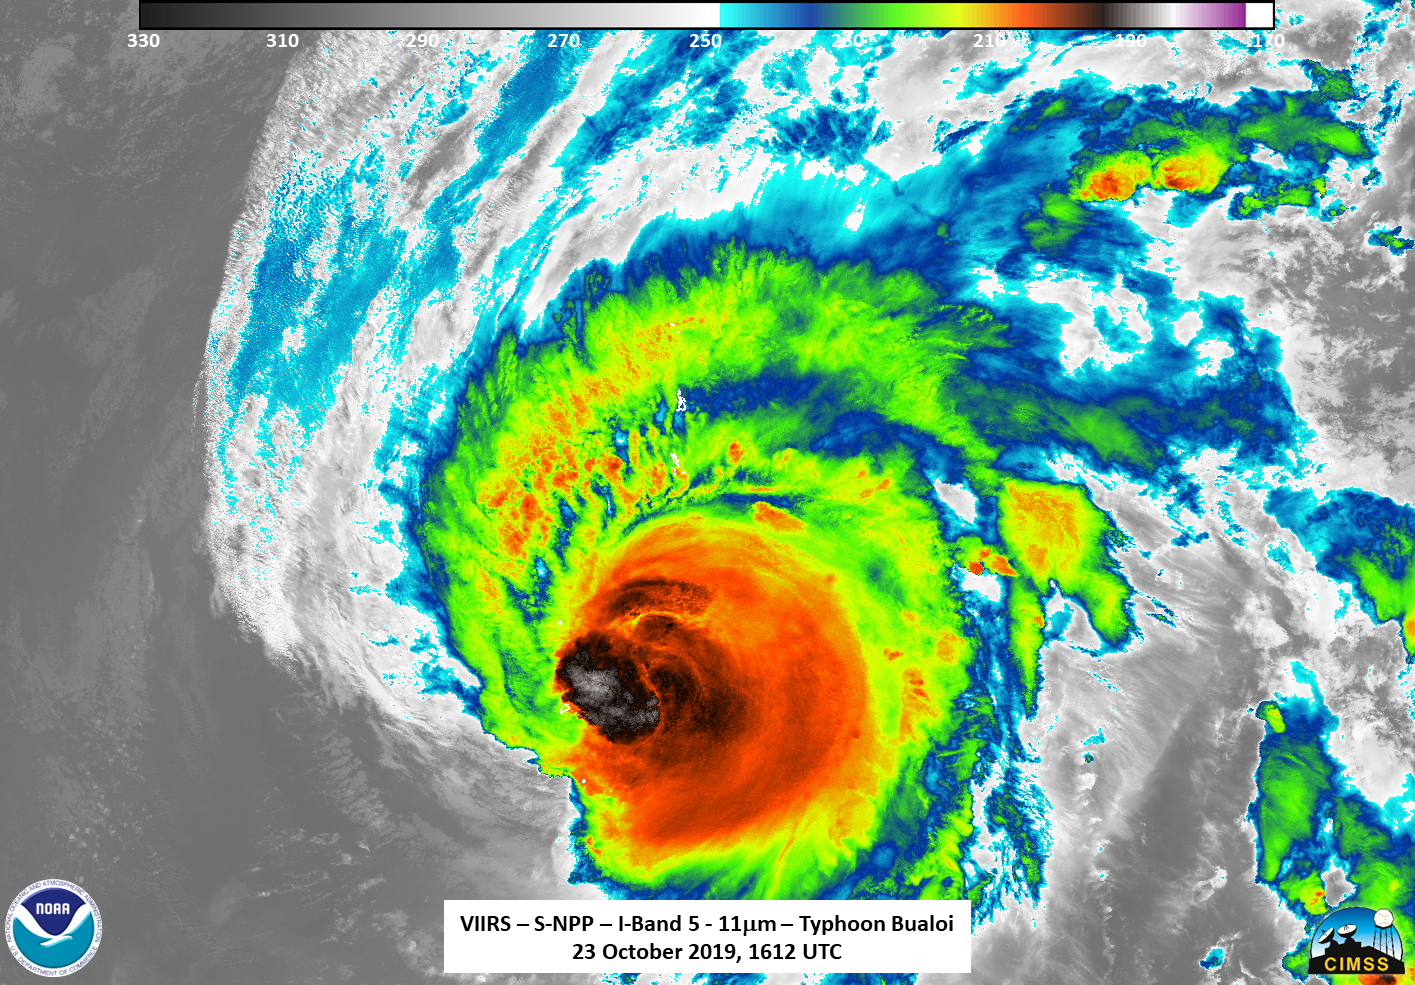
Suomi-NPP (S-NPP) was the next satellite to see Typhoon Bualoi at ~1612Z, this time with a close to nadir overpass. The waning crescent (28% illumination) and lunar geometry meant that the storm itself was illuminated primarily by airglow while some of the features further away were illuminated by the faint moonlight, as can be seen in the zoomed out imagery below

There were some features that could be seen, namely the structure of the storm, in the DNB imagery, along with a lightning streak in one of the feeder bands. However, as it appears this storm was weakening, there were no other mesospheric features seen. The I05 (11μm) brightness temperature again showed this asymmetrical orientation with the circulation being hidden in the convection. Also, the southern part of the storm seems to have some dry air intruding in on it, simply based on the IR appearance.
As with yesterday, the coldest air that was seen by the ATMS instrument was on the other side of where the convection was, as seen below in the I05 (11μm)/ATMS comparison:
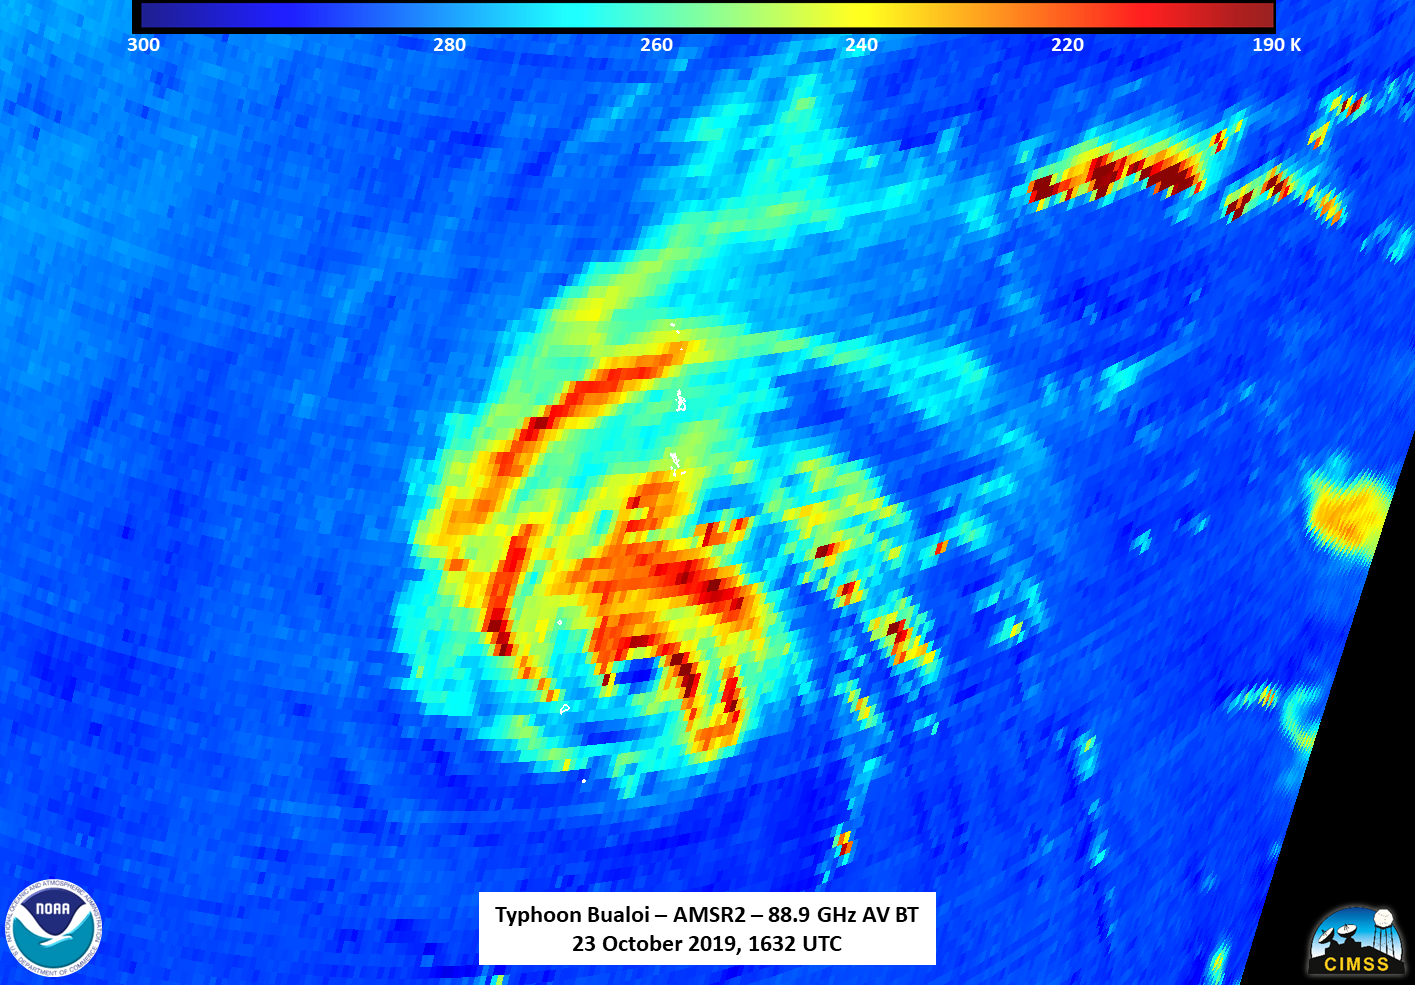
About 20 minutes later, the AMSR2 instrument on the GCOM-W1 satellite observed Bualoi at ~1632Z, just on the eastern side of the pass. The 88.9GHz, which can see inside of the storm, observed similar features to the GMI instrument about an hour and a half earlier. This includes a nearly exposed eye with warmer air intruding into the circulation.
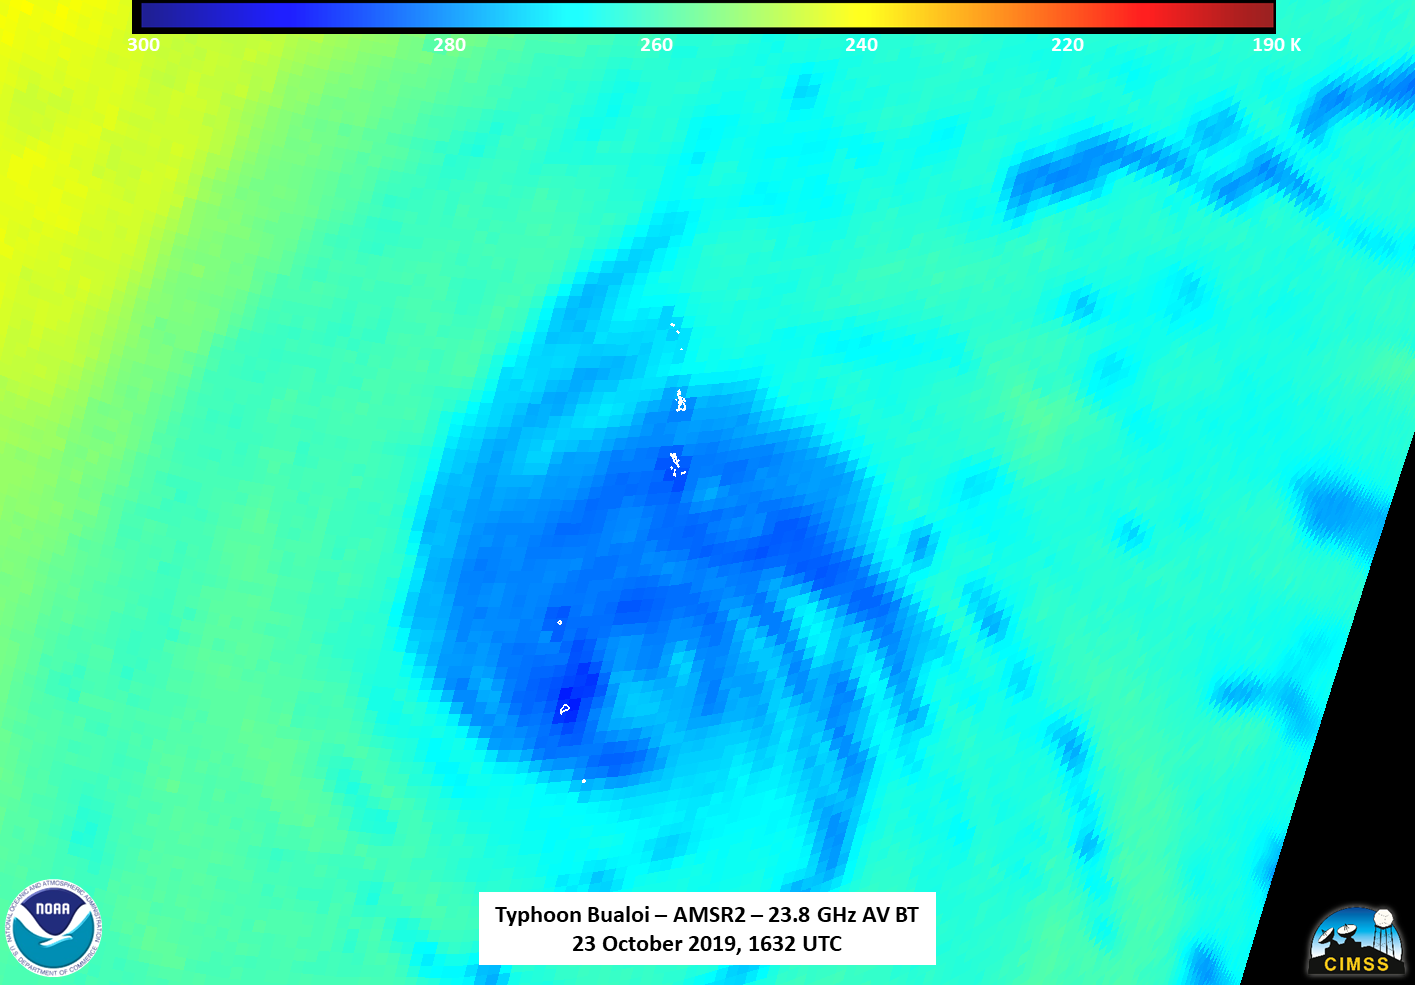
Again, if one compares to the 23.8Ghz Brightness temperature, one will notice that the circulation is offset from one another.
The 23.8Ghz circulation continues to appear to be displaced to the east of the 88.9GHz center, continuing to indicate a possible easterly wind shear. Also of note is the warmer air intruding into the circulation seen in the 23.8Ghz channel. This again indicates that the storm is likely weakening
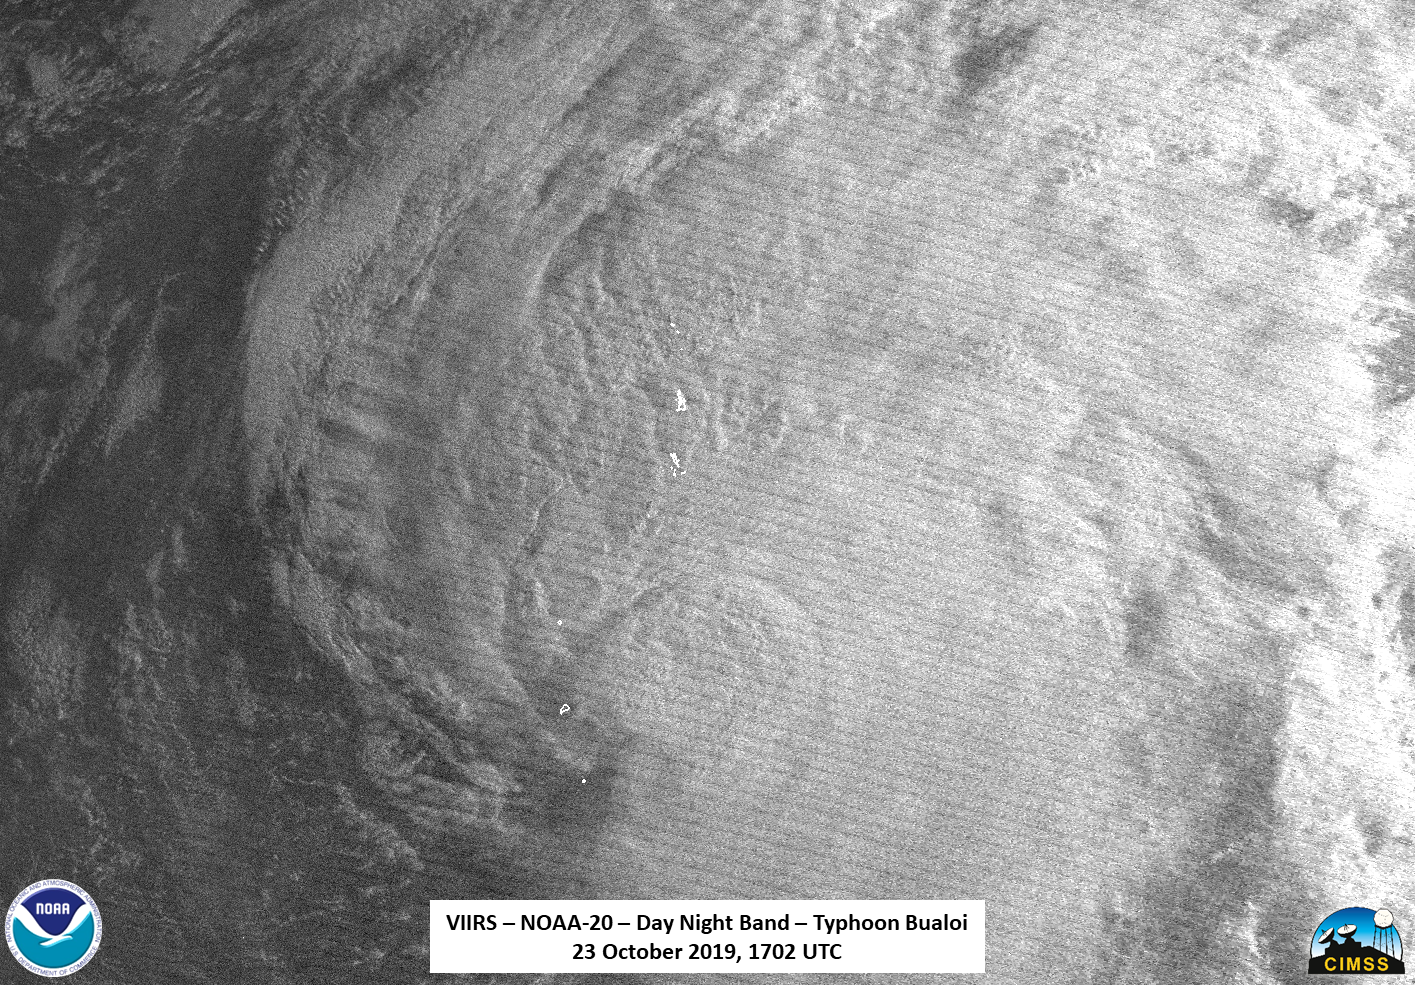
The final satellite to see Bualoi was NOAA-20 at ~1705Z on the eastern side of the pass. Now the I05 (11μm) brightness temperature did not really observe the storm. However, making use of the extended granule on NOAA-20 in the Day Night Band (DNB) meant that, due to the lunar geometry and phase, one could still see visible imagery and see cloudtop features. This includes the dry air moving into the circulation center to the ENE of Iō-tō (硫黄島), which is Iwo Jima in english.
Bualoi is expected to weaken as it continues north, well away from the main islands of Japan per the Joint Typhoon Warning Center forecast and JMA. Both of these forecasts continue to be in fairly good agreement on the rough timing and direction of the storm.