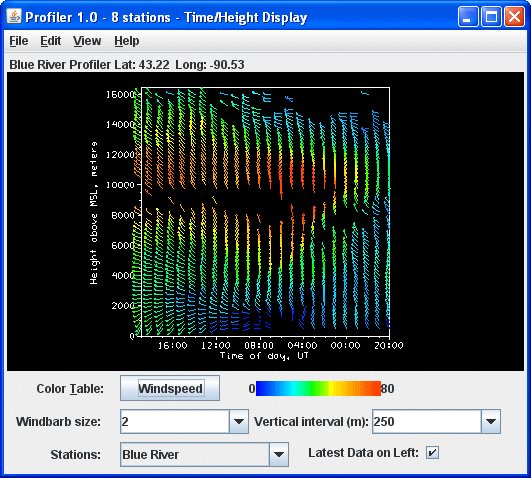
Image 1: Time/Height Display
McIDAS-V Profiler Time/Height plot shows wind data from any of the NOAA National Profiler Network stations. You can choose hourly, 30 minute, 12 minute, or 6 minute data.
The Time/Height display displays in the Layer Controls tab of the Data Explorer. For more information on the controls for this display, see Profiler Time/Height Controls.
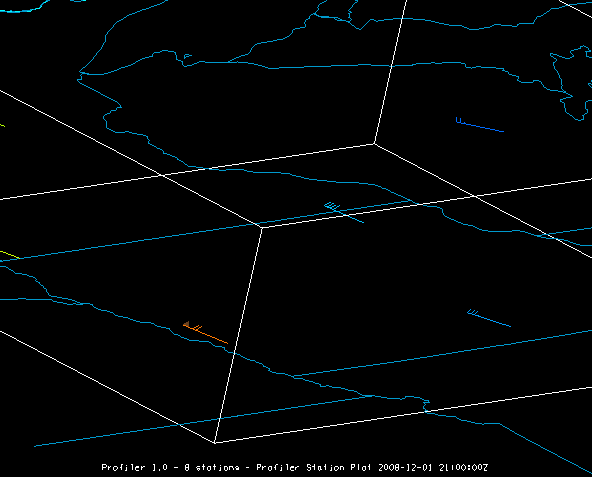
The Profiler Station Plot display displays in the Main Display window, and its controls are in the Layer Controls tab of the Data Explorer. For more information about the controls for this display, see Profiler Station Plot Controls.
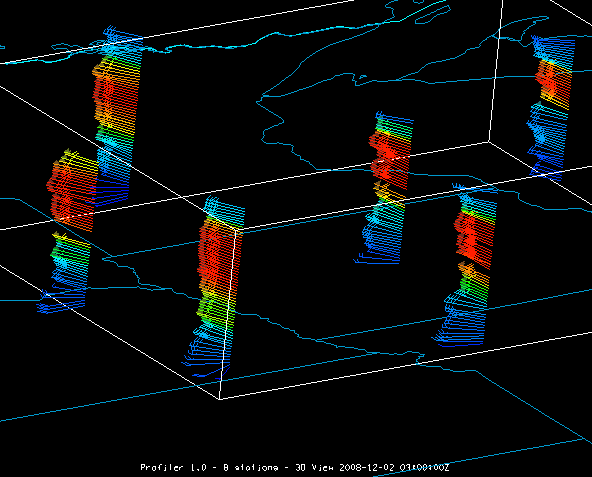
The 3D View display displays in the Main Display window, and its controls are in the Layer Controls tab of the Data Explorer. For more information about the controls for this display, see Profiler 3D Multi-Station Controls.