
For additional information about the functions described in this section, see the online man pages provided with the McIDAS-X software.
McIDAS Programmer's Manual
Version 2015
[Search Manual] [Table of Contents] [Go to Previous] [Go to Next]
The McIDAS-X library provides many functions for displaying text on the McIDAS-X Text and Command Window and displaying images and graphics on the McIDAS-X Image Window.
This section provides descriptions and examples of the functions that you can use in your programs to display text, images and graphics on the McIDAS-X windows, and to obtain information about the McIDAS-X display.
For additional information about the functions described in this section, see the online man pages provided with the McIDAS-X software. |

McIDAS-X has three types of text messages that you can use in your applications:
You should insert debug messages to help trace progress in applications, avoiding extraneous or misleading messages. Also avoid placing debug messages in code where thousands of lines of output could be generated. You will probably not have sufficient room on the McIDAS-X Text and Command Window to view that much output and even if the debug messages are suppressed, they will increase CPU usage unnecessarily.
Figure 4-2. The McIDAS-X Text and Command Window displays standard, error and debug text messages
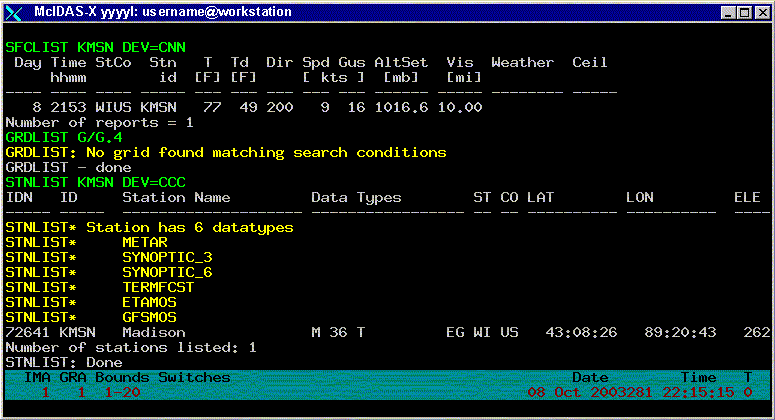
Text can be sent, or routed, to several destinations, as shown in the table below. Users enter the McIDAS-X global keyword, DEV, to specify the destination device of the text output generated by a command.
| This DEV= option | Sends the output to |
|---|---|
McIDAS-X Text and Command Window (default for standard and error messages) |
|
The user enters the disposition of the text messages as a series of three, contiguous disposition types in this order: standard, error, debug. For example, if the user enters DEV=CCC, all standard, error and debug messages are written on the McIDAS-X Text and Command Window. Entering DEV=CNN displays only the standard messages on the window; the error and debug messages are suppressed. The default is DEV=CCN, meaning the standard and error messages are written on the McIDAS-X Text and Command Window and the debug messages are suppressed.
For more information about McIDAS-X global keywords, see the McIDAS User's Guide. |
To display standard, error and debug messages in C or Fortran applications, use the library functions shown in the table below.
| C function | Fortran function | Message type |
|---|---|---|
The sample code below illustrates the use of each message type in a Fortran application.
The following table shows where text would be routed, based on the application, ABCD, presented in the code above.
If you don't have an integer value to be printed at the end of sdest, edest or ddest calls, specify zero as the second argument. These functions don't print an integer value of zero. To print a zero, format it into the string. The lines below show the use of a Fortran write to format a text message.
write(cline,fmt='(a18,1x,f9.2)')'the temperature is',temp call sdest(cline,0) |
You can create the same formatted output with the following C call.
(void) Mcprintf ("the temperature is %9.2f\n ",temp); |
Although sdest, edest and ddest automatically insert a new line when they are called, you must explicitly include the new line character, \n, in applications calling Mcprintf, Mceprintf and Mcdprintf.
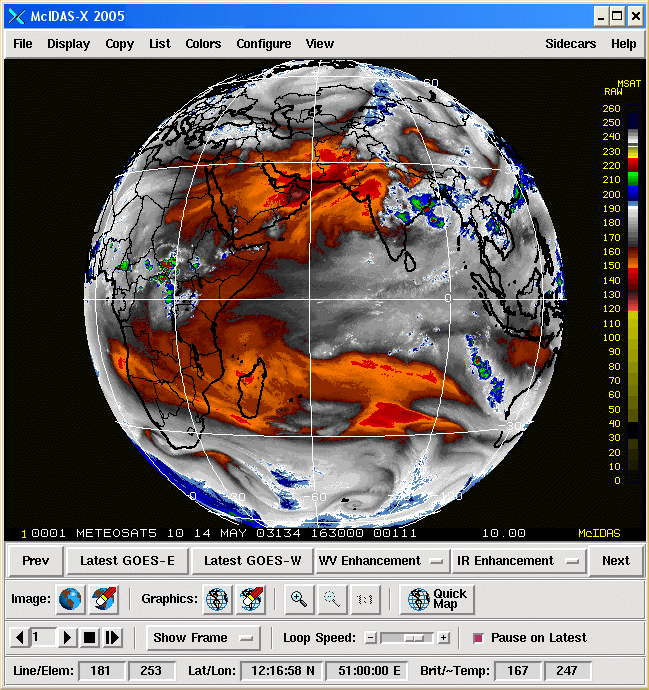
An image is information that is usually represented as shades of gray in a two-dimensional matrix, such as a satellite image, a radar image or an image derived from grids. Images are displayed on the McIDAS-X Image Window, as shown in Figure 4-3.
Figure 4-3. The McIDAS-X Image Window displays McIDAS-X-generated images.
You will use the mcline function to write a line of image data into a frame object for display on the McIDAS-X Image Window. A frame object is a memory-based collection of information that completely describes the contents and appearance of a frame to the mcimage process, which creates a visible picture. A frame object contains the actual image data, along with navigation and color enhancement information. Frame objects are stored in McIDAS-X shared memory. The number and size of the frame objects allowed per McIDAS-X session are user-configurable.
The sample code below illustrates how to use mcline to write a frame object. Note that the mcline function writes an entire line. Use mclineseg to write only a partial line.
The output from this code displays a series of black-to-white gray shades. It may not map to the McIDAS-X Image Window quite as you expect, however. McIDAS-X applications envision the McIDAS-X Image Window as being n lines by m elements, and capable of displaying 256 colors. Each element in the array holds a 1-byte value (0 to 255) representing a brightness value.
McIDAS-X applications use the mcline function to write image data, or brightness levels, into a frame object. The mcimage program then takes this 8-bit image data and maps it into the McIDAS-X Image Window. Because hardware configurations impose limitations on the number of displayable brightness levels, the image data in the frame object must pass through a filter that maps the brightness levels into the range of display levels. Consequently, the image brightness levels in the frame object rarely correspond one-to-one with the display levels in the McIDAS-X Image Window.
For more information about McIDAS-X image display characteristics, see the McIDAS-X TERM command with the SCALE option in the McIDAS User's Guide. Also see the section titled Displaying Images and Graphics in the Introduction chapter of the McIDAS User's Guide. |
|
 |
For more information about McIDAS-X shared memory and frame objects, see the section titled Shared memory in Chapter 2, Learning the Basics. |
McIDAS-X graphics appear to the user as text, symbols and line segments drawn in color on the McIDAS-X Image Window. Though displayed as part of the same frame object as images, graphics are manipulated through a separate, vector-based API. Vector-based means that graphics are produced by an imaginary drawing pen that can be moved about on the frame by function calls. The pen traces a line segment of the specified color as it moves, and the graphics subsystem converts this into the appropriate pixels and places it in the frame object. McIDAS-X also provides a simple interface for writing text and numbers as vector graphics.
This section describes how to use the graphics subsystem, providing both basic and advanced McIDAS-X graphics techniques. An extended example, GRAF.PGM, and the output it produces, accompanies much of the discussion. The listing for GRAF.PGM appears later in this section.
The table below alphabetically lists the McIDAS-X graphics functions used on the following pages. Additional graphics functions for displaying wind barbs, wind vectors, and weather symbols on a frame are provided later in this section.
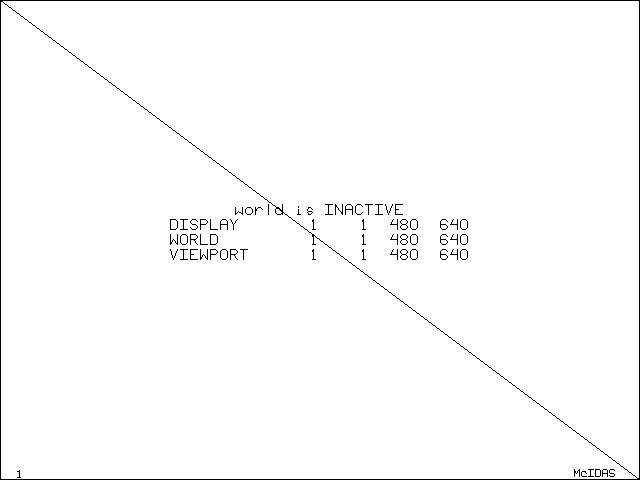
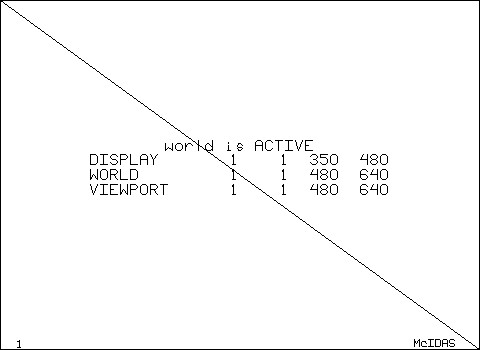
This section describes the techniques that you will most often use when working with the McIDAS-X graphics subsystem. Figure 4-4 below shows a graphic produced by the sample GRAF application when run from a McIDAS-X session with no arguments and a frame size of 480 lines by 640 elements.
Figure 4-4. This GRAF.PGM output is the result of a McIDAS-X session run with no arguments and a frame size of 480 lines by 640 elements.
To produce such a graphic, an application must do the following:
Before you can use the McIDAS-X graphics subsystem, you must initialize it with a call to initpl as shown in the following code fragment from GRAF.PGM, lines 88 to 93; frame is the number of the frame where the graphics will appear and width is the line width, in pixels. Specify zero to use the current frame and width.
C // Initialize the plot and fetch the color frame = luc(-1) call initpl( frame, width ) if( mccmdint('COL.OR', 1, 'Graphic Color', 3, 1, 3, & color ) .lt. 0 ) return |
All graphics objects are composed of line segments built using the plot function. The graphics subsystem lets you specify the following line segment attributes:
The diagonal line in Figure 4-4 is generated by these lines of code (91 to 132) in GRAF.PGM:
call initpl( frame, width ) ... call plot( w_ullin, w_ulele, PEN_UP ) call plot( w_lrlin, w_lrele, color ) call enpt |
The second plot call draws the line in color level color from the previous cursor position to line w_lrlin and element w_lrele, here the lower-right corner of the frame. The previous position is always the one specified by the most recent plot call; the PEN_UP defined constant, with a value of zero, moves the pen from its previous, undefined location to the start of the line at (w_ullin,w_ulele) without drawing.
To use a particular graphics form repeatedly, you can write a routine to generate it at the desired location with desired attributes. A simple example from GRAF.PGM, lines 263 to 286, is shown below.
This example draws rectangles on the display with a single call and makes applications easier to write and understand.
The dash mode is set by the dshon and dshoff functions. To determine the current mode at any time, call the qgdash function.
When a McIDAS-X session starts, the dash pattern is preset to 10 pixels on and 10 pixels off. You can change this pattern using the McIDAS-X GD command, either from the command line before running any graphics applications, or within an application using the keyin or Mckeyin functions. These values are stored in User Common words 47 to 49.
Lines 146 to 151 in GRAF.PGM draw a dashed box to outline the viewport, which is described later, using the calls below.
if( border .gt. 0 ) then call qgdash( old_dash ) call dshon call box( v_ullin, v_ulele, v_lrlin, v_lrele, color ) if( old_dash .eq. 0 ) call dshoff end if |
Though not strictly necessary in this context, this sequence also illustrates a helpful idiom: capturing an aspect of graphics status (here the dashing state old_dash), changing it to a known state (dshon) and then restoring the original state when done. Such behavior is especially important when writing library functions, since they should be careful to leave things the way they found them.
The line width is established when the graphics subsystem is initialized with initpl. To change the line width, you must close the current graphic and restart another, specifying a new width. Previously drawn graphics remain on the frame with the former line width and new graphics are drawn with the new line width.
The McIDAS-X library provides two graphics functions, wrtext and pltdig, for writing text and numbers on a graphics frame. When using these functions, you must designate the following:
Lines 361 to 386 in GRAF.PGM use wrtext to produce the alphanumeric characters shown in Figure 4-4 through its own plttext subroutine, as shown below.
For titles and labels, it is often easier to decide where text should be centered rather than where its left margin should be. The above code uses the number of characters nchar and height in pixels txthgt to compute the offsets in line and element from the center to the upper-left. The internal plttext subroutine encapsulates the logic and other computations to account for graphics scaling so GRAF.PGM generates a centered line of text with a single call, just as box draws a graphics object in a clear, abstract way.
The pltdig function is similar to wrtext except that it also allows the user to specify the number of spaces. If the value to be plotted contains fewer digits, the result is left-padded with zeros.
Because the graphics subsystem is buffered, graphics may not appear as they are being drawn. Interactive applications may need to force graphics to appear at various stages in the process. To do this, you must enter the call below to flush the buffers without ending the application's ability to draw additional graphics.
call enpt |
In the listing for GRAF.PGM, this is done at the end of the box and plttext subroutines (lines 286 and 388). All graphics drawn to that point become visible and the graphics package, including all graphics options the application may have set, remains active.
When you're done creating graphics, call the endplt function (line 224 in GRAF.PGM) to bind off the graphics as shown below.
call endplt |
Calling endplt displays all graphics on the McIDAS-X Image Window and frees all associated resources. To create more graphics on this or other frames, you will have to call initpl again.
This section describes some advanced techniques that you can use with the McIDAS-X graphics subsystem. It builds upon the example and the McIDAS-X session started in the previous section, Basic McIDAS-X graphics techniques.
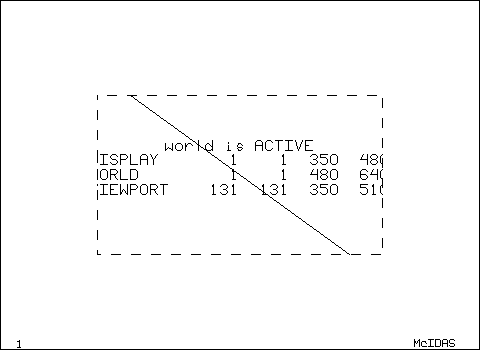
The example presented in the previous section positioned and drew all graphics in terms of pixel locations on the screen, assuming the typical frame size of 480 lines by 640 elements. However, McIDAS-X frames don't have a fixed size. If you restart the previous McIDAS-X session with a frame size of 350 by 480 and rerun GRAF.PGM, the display will look like Figure 4-5 below.
Figure 4-5. This GRAF.PGM output is the result of a McIDAS-X session run with no arguments and a frame size of 350 lines by 480 elements.
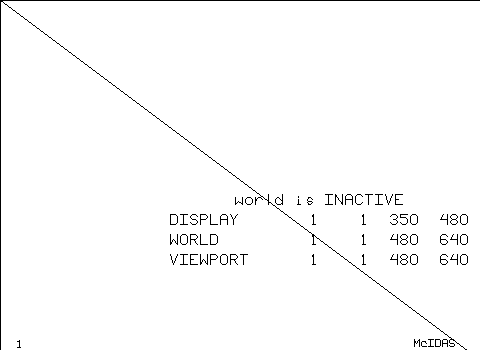
Although the text is still centered on (240,320), this is no longer the center of the frame. The text message describing the frame size gets its values from this line of code (line 195) in GRAF.PGM:
call mcfsize( frame, f_nlins, f_neles ) |
The upper-left corner is always (1,1) and the lower-right corner (f_lrlin, f_lrele) can be readily computed from the size.
The problem of positioning graphics in frames of various sizes remains, however. An obvious solution is for the application to create its graphics objects in some normal coordinate system in which the frame always occupies the same range, whatever its physical size in pixels. McIDAS-X refers to such systems as scaled or world coordinates because they let graphics applications run in their own little world, which is always the size that the application finds convenient. McIDAS-X supports the use of world coordinates with the page, sclon, scloff, sclpnt and sclhgt functions.
To use world coordinates properly, you must understand the concepts of defining and activating worlds. The sclon function activates world coordinates (scaling) and scloff deactivates them. You can use only one coordinate system, either world or frame, at a time. All functions that generate graphics using a line or element pixel coordinate (plot, pltdig, wrtext) use the current system, whether frame or world. Frame coordinates are determined entirely by the hardware and/or the McIDAS-X session; world coordinates, on the other hand, may be defined to be convenient for the application. The initpl function defines a default world of 480 lines by 640 pixels; this world may be redefined using the page function. Keep in mind that page also activates the world it defines, whereas initpl does not.
In Figure 4-5, the world is defined to be 480 by 640 by initpl but not activated, as noted on the display. If you instead enter this command:
GRAF.PGM looks at the four WORLD parameters and defines and activates a world using the code below (lines 99 to 117).
The resulting output is shown in Figure 4-6 below.
Figure 4-6. This GRAF.PGM output uses world coordinates to position the text.
The diagonal now goes from corner to corner as in Figure 4-4 and the text is again centered even though the frame sizes are different. Making applications that can generate attractive, properly positioned output regardless of the physical size of the frame is the primary use of world coordinates and the page function. If a 480 by 640 world is suitable, you can just enter the calls below to activate initpl's default world.
call initpl( frame, width ) call sclon |
In general, you should use a world that is as large as or larger than your largest frame size to minimize truncation errors resulting from a single world pixel occupying multiple pixels of the frame.
One complication of world coordinates is the positioning and sizing of text. The wrtext function can be given positions and a height in either frame or world coordinates. If the world is smaller than the frame, the text is enlarged; if the world is larger than the frame, the text is not reduced. This prevents the text from becoming too small to read. The difficulty is that the application must be able to account for both cases when centering text. One solution is to do the positioning and output directly in frame coordinates even if scaling is on; the sclpnt and sclhgt functions allow explicit conversion of points and text heights from world to frame coordinates. The plttext subroutine in GRAF.PGM, lines 354 to 386, illustrates this technique as shown in the code samples below.
The actual text size in frame coordinates is determined first:
The center point is then transformed to frame coordinates:
Then the upper-left corner is computed, again in frame coordinates:
Given that the position is in frame coordinates already, you must verify that scaling is off before calling wrtext and then be sure to restore the scaling to its original setting, whether off or on, before returning control to the caller:
In the above examples, you used world coordinates to make graphics applications independent of frame size. You can also change the orientation and origin of world coordinates as well as their extent.
Some graphics such as scatter plots are easier to generate in an (x,y) coordinate system in which x increases leftward and y increases upward. The page function allows this, but there are two caveats. First, you should make your world domains as large as, or larger than, the frame to avoid truncation. Second, inverting the world by making either coordinate decrease, rather than increase, from the upper-left corner of the frame to the lower-right may cause confusion if you want to display text in world coordinates or use viewports (see below). The difficulty with text is that a specific, negative scale factor for line may result in text becoming very small or invisible.
For more information about frame coordinates, see the section titled Coordinate systems in Chapter 2, Learning the Basics. |
Sometimes it is desirable to limit graphics to a particular region of the frame. Consider Figure 4-7 below, which is identical to Figure 4-6 except the line segment is only drawn when it is more than 130 pixels, in world coordinates, from the edge of the world.
Figure 4-7. This GRAF.PGM output shows a viewport, or clipping region.
One solution is to determine the intersection of the diagonal with the 130-pixel border to get two new endpoints for the line segment. This algorithm is cumbersome because the diagonal may intersect with any two of the borders. The simple solution, supported by the McIDAS-X graphics subsystem, is to use a viewport. Also called a clipping region, a viewport defines a region of the frame outside of which graphics will not appear even if drawn. Like worlds, viewports are defined using page, but with a fifth argument of zero instead of one. Lines 139 to 151 in GRAF.PGM define the above viewport and draws its extent, as shown below.
Note that the viewport also clips text. The main use of viewports in McIDAS-X programming is to generate graphical output in regions set by the LINE and ELEM keywords, as is done by the McIDAS-X commands PTLIST and GRDDISP. Some users have written simple, frame-based graphical interfaces that set aside a portion of the frame as a toolbar and use a viewport to prevent meteorological data from plotting there when the rest of the frame is generated.
  1 C   THIS IS SSEC PROPRIETARY SOFTWARE - ITS USE IS RESTRICTED.
  2
  3 C *** McIDAS Revision History ***
  4 C *** McIDAS Revision History ***
  5
  6 C ? GRAF -- Demo of basic McIDAS graphics
  7 C ?   GRAF <keywords>
  8 C ? Parameters:
  9 C ?   (none)
 10 C ? Keywords:
 11 C ?   BORDER   = | border width, in pixels
 12 C ?   COLOR    = | graphics color level
 13 C ?   WORLD    = | mn_lin mn_ele mx_lin mx_ele  to define and
 14 C ?              | activate a world
 15 C ? Remarks
 16 C ?       This demo nominally draws a diagonal line from
 17 C ?   the upper left to the lower right of the display.
 18 C ?
 19 C ?       If WORLD= arguments are not specified, the initpl()
 20 C ?   default world of 480 lines by 640 elements is defined
 21 C ?   but not activated. The diagonal line will be correct
 22 C ?   only if the display size is 480 by 640. If WORLD= arguments
 23 C ?   are specified the world will be defined and activated and
 24 C ?   the diagonal correct regardless of world size.
 25 C ?
 26 C ?   BORDER= defines a viewport (clipping region) the indicated
 27 C ?   number of pixels (world coordinates) from the edge of the
 28 C ?   world and outlines it with a dashed line.
 29 C ? ----------
 30       subroutine main0
 31
 32       implicit      NONE
 33
 34 C --- Constants and shared variables
 35
 36       integer       PEN_UP  ! move pen without drawing
 37       integer       SET_VIEW    ! define a viewport
 38       integer       SET_WORLD   ! define a world
 39       parameter            ( PEN_UP = 0, SET_VIEW = 0, SET_WORLD = 1)
 40
 41 C --- local variables
 42
 43       character*80  text        ! output text buffer
 44
 45       integer       border  ! border (view port) width
 46       integer       cele    ! text center element
 47       integer       clin    ! text center line
 48       integer       color   ! color level
 49       integer       frame   ! frame number
 50       integer       f_lrele ! frame lower right element
 51       integer       f_lrlin ! frame lower right line
 52       integer       f_neles ! number of elements in frame
 53       integer       f_nlins ! number of lines in frame
 54       integer       f_ulele ! frame upper left element
 55       integer       f_ullin ! frame upper left line
 56       integer       hgt ! text height
 57       integer       linspac ! spacing between text lines
 58       integer       old_dash    ! dashing mode
 59       integer       sclstat ! scaling (world) mode
 60       integer       v_lrele ! lower left viewport element
 61       integer       v_lrlin ! lower left viewport line
 62       integer       v_ulele ! upper right viewport element
 63       integer       v_ullin ! upper right viewport line
 64       integer       w_lrele ! lower right world element
 65       integer       w_lrlin ! lower right world line
 66       integer       w_ulele ! upper left  world element
 67       integer       w_ullin ! upper left  world line
 68
 69       real      elew2f  ! element frame:world ratio
 70       real      linw2f  ! line frame:world ratio
 71
 72 C --- External functions
 73
 74       integer       luc ! user common peek
 75       integer       mccmdint    ! integer argument fetch
 76       integer       mccmdnum    ! number of args for keyword
 77
 78 C --- Initialized variables
 79
 80       integer       width   ! line width (session current)
 81
 82       data      width  /   0/
 83
 84 C ---------------------------------------------------------------
 85 C INITIALIZE
 86 C ---------------------------------------------------------------
 87
 88 C     // Initialize the plot and fetch the color
 89
 90       frame = luc(-1)
 91       call initpl( frame, width )
 92       if( mccmdint('COL.OR', 1, 'Graphic Color', 3, 1, 3,
 93      &  color ) .lt. 0 ) return
 94
 95 C ---------------------------------------------------------------
 96 C DEFINE THE WORLD AND DRAW BORDER AND DIAGONAL
 97 C ---------------------------------------------------------------
 98
 99 C     // If the user has specified the necessary four arguments to
100 C     // WORLD= read them and define the world; page()
101 C     // automatically activates it.
102 C     // The defaults are 1 1 480 640 but there is no significance
103 C     // to this here; the argfetchers will trigger a return
104 C     // if the user doesn't actually enter a legal value for
105 C     // each of the four positions
106
107       if( mccmdnum('WORLD') .eq. 4 ) then
108           if( mccmdint('WORLD',1, 'World upper left line',
109      &      1, 1, 0, w_ullin ) .lt. 1100 ) return
110           if( mccmdint('WORLD',2, 'World upper left element',
111      &      1, 1, 0, w_ulele ) .lt. 1100 ) return
112           if( mccmdint('WORLD',3, 'World lower right line',
113      &      1, 1, 0, w_lrlin ) .lt. 1100 ) return
114           if( mccmdint('WORLD',4, 'World lower right element',
115      &      1, 1, 0, w_lrele ) .lt. 1100 ) return
116           call page( w_ullin, w_ulele, w_lrlin, w_lrele, SET_WORLD )
117       end if
118
119 C     // get the world definition. Note that there
120 C     // is always a defined world, whether by initpl() or
121 C     // page().
122
123       call world( w_ullin, w_ulele, w_lrlin, w_lrele )
124
125 C     // draw the border and diagonal
126
127       call qgdash( old_dash )
128       call dshoff
129       call box ( w_ullin, w_ulele, w_lrlin, w_lrele, color )
130       call plot( w_ullin, w_ulele, PEN_UP )
131       call plot( w_lrlin, w_lrele, color  )
132       call enpt
133       if( old_dash .ne. 0 ) call dshon
134
135 C ---------------------------------------------------------------
136 C DEFINE THE VIEWPORT AND DRAW BORDER
137 C ---------------------------------------------------------------
138
139       if( mccmdint('BOR.DER', 1, 'Border Width', 0, 0,
140      &  (w_lrlin-w_ullin)/3, border ).lt. 0 ) return
141       v_ullin = w_ullin + border
142       v_ulele = w_ulele + border
143       v_lrlin = w_lrlin - border
144       v_lrele = w_lrele - border
145       call page( v_ullin, v_ulele, v_lrlin, v_lrele, SET_VIEW )
146       if( border .gt. 0 ) then
147           call qgdash( old_dash )
148           call dshon
149           call box( v_ullin, v_ulele, v_lrlin, v_lrele, color )
150           if( old_dash .eq. 0 ) call dshoff
151       end if
152
153 C ---------------------------------------------------------------
154 C GENERATE AND DISPLAY THE TEXT MESSAGES
155 C ---------------------------------------------------------------
156
157 C     // Fetch the text height and use it and the scale factors
158 C     // to determine the separation between text lines. If the
159 C     // line scale factor is less than one, the text locations
160 C     // will be moved closer together by the scaling but the
161 C     // text height will be unchanged. So increase the separation
162 C     // between lines (in world coordinates) to prevent overwrite.
163
164       if( mccmdint('HGT', 1, 'Text Height', 10, 5, 20,
165      &  hgt ) .lt. 0 ) return
166       call qscale( sclstat )
167       call sclfac( linw2f, elew2f )
168       if( sclstat.eq. 1 .and. linw2f.lt. 1.0 ) then
169           linspac = 1.5*hgt / linw2f
170       else
171           linspac = 1.5*hgt
172       end if
173
174 C     // Determine the center of the topmost five lines.
175 C     // Center the third line in the world; this will illustrate
176 C     // the main use of world coordinates to preserve centering
177 C     // even when display sizes differ.
178
179       call world( w_ullin, w_ulele, w_lrlin, w_lrele )
180       clin = w_ullin + (w_lrlin-w_ullin)/2 - 2*linspac
181       cele = w_ulele + (w_lrele-w_ulele)/2
182
183 C     // Display scaling status.
184
185       call qscale(sclstat)
186       if( sclstat.eq. 1) then
187          text = 'world is ACTIVE'
188       else
189          text = 'world is INACTIVE'
190       end if
191       call plttext( clin, cele, hgt, color, text )
192
193 C     // Get and display frame size.
194
195       call mcfsize( frame, f_nlins, f_neles )
196       f_ullin =                     1
197       f_ulele =                     1
198       f_lrlin = f_nlins + f_ullin - 1
199       f_lrele = f_neles + f_ulele - 1
200       write(text,30) f_ullin, f_ulele, f_lrlin, f_lrele
201   30  format('DISPLAY   ',4I5)
202       clin = clin + linspac
203       call plttext( clin, cele, hgt, color, text )
204
205 C     // Display world size.
206
207       call world( w_ullin, w_ulele, w_lrlin, w_lrele )
208       write(text,32) w_ullin, w_ulele, w_lrlin, w_lrele
209   32  format('WORLD     ',4I5)
210       clin = clin + linspac
211       call plttext( clin, cele, hgt, color, text )
212
213 C     // Display viewport size.
214
215       write(text,34) v_ullin, v_ulele, v_lrlin, v_lrele
216   34  format('VIEWPORT  ',4I5)
217       clin = clin + linspac
218       call plttext( clin, cele, hgt, color, text )
219
220 C ---------------------------------------------------------------
221 C CLEAN-UP
222 C ---------------------------------------------------------------
223
224       call endplt
225
226       call sdest('done',0)
227       return
228       end
229
230
231 ** Name:
232 **  box - draw a box on the display
233 **
234 ** Interface:
235 **  subroutine
236 **  box(integer ullin, integer ulele, integer lrlin,
237 **        integer lrele, integer color)
238 **
239 ** Input:
240 **  ullin    - upper left line
241 **  ulele    - upper left element
242 **  lrlin    - lower right line
243 **  lrele    - lower right element
244 **  color    - color of box
245 **
246 ** Input and Output:
247 **  none
248 **
249 ** Output:
250 **  none
251 **
252 ** Return values:
253 **  none
254 **
255 ** Remarks:
256 **  Input coordinates will be interpreted as either frame or
257 **  world system depending upon whether the caller has activated
258 **  a world or not.
259 **
260 ** Categories:
261 **  graphic
262
263       subroutine box( ullin, ulele, lrlin, lrele, color )

264
265       implicit      NONE
266
267 C --- interface variables
268
269       integer       ullin
270       integer       ulele
271       integer       lrlin
272       integer       lrele
273       integer       color
274
275 C --- symbolic constants and shared values
276
277       integer       PEN_UP  ! move pen without drawing
278       parameter            ( PEN_UP = 0)
279
280
281       call plot( ullin, ulele, PEN_UP )
282       call plot( ullin, lrele, color  )
283       call plot( lrlin, lrele, color  )
284       call plot( lrlin, ulele, color  )
285       call plot( ullin, ulele, color  )
286       call enpt
287
288       return
289       end
290
291 ** Name:
292 **  plttext - Center a line of text on the indicated location
293 **
294 ** Interface:
295 **  subroutine
296 **  plttext(integer clin, integer cele, integer hgt,
297 **        integer color, character*(*) text)
298 **
299 ** Input:
300 **  clin    - center line
301 **  cele    - center element
302 **  hgt     - text height
303 **  color   - text color
304 **  text    - text string
305 **
306 ** Input and Output:
307 **  none
308 **
309 ** Output:
310 **  none
311 **
312 ** Return values:
313 **  none
314 **
315 ** Remarks:
316 **  The text will be centered on (clin,cele) in either world
317 **  or frame coordinates, depending upon whether the caller has
318 **  activated a world or not. If a world is active, the actual
319 **  text will be enlarged if the world is smaller than the frame.
320 **  If the world is larger, the text size will be unchanged.
321 **  In order to keep the text centered, this routine does all
322 **  of its own scaling (using sclhgt and sclpnt) and actually
323 **  writes the text in frame coordinates. The display is then
324 **  returned to the initial state set by the caller.
325 **
326 ** Categories:
327 **  graphic
328
329       subroutine plttext( clin, cele, hgt, color, text )

330
331       implicit      NONE
332
333 C --- interface variables
334
335       integer       clin
336       integer       cele
337       integer       hgt
338       integer       color
339       character*(*)     text
340
341 C --- local variables
342       integer       ullin   ! upper left of text (frame)
343       integer       ulele   ! upper left of text (frame)
344       integer       txthgt  ! text height, frame coords
345       integer       txtclin ! text center, frame coords
346       integer       txtcele ! text center, frame coords
347       integer       sclstat ! scaling status
348       integer       nchar   ! number of characters in text
349
350 C --- external functions
351
352       integer       len_trim    ! compute length of text
353
354 C --- Determine the actual (frame coordinates) height of the
355 C --- text. (The use of local variable 'txthgt' is needed to keep
356 C --- plttext()from modifying its inputs.)
357
358       txthgt = hgt
359       call sclhgt( txthgt )
360
361 C --- Determine the center point in frame coordinates. Because
362 C --- sclpnt() always works whether the world is active or not,
363 C --- make this call only if scaling is actually on.
364
365       call qscale( sclstat )
366       if( sclstat .eq. 1 ) then
367           call sclpnt( clin, cele, txtclin, txtcele )
368       else
369           txtclin = clin
370           txtcele = cele
371       end if
372
373 C --- Determine the length of the text message in characters.
374 C --- This information is then used, together with the actual
375 C --- heights, to compute the upper left corner in frame coordinates.
376       nchar = len_trim( text )
377       ullin = txtclin - txthgt/2
378       ulele = txtcele - txthgt*nchar/2 + txthgt/10
379
380 C --- Display the text. Turn scaling off first (we have figured
381 C --- the text height and location in frame coordinates ourselves,
382 C --- right?) but be sure to restore it to its original state
383 C --- according to the result 'sclstat' of the qscale() call above.
384       call scloff
385       call wrtext( ullin, ulele, txthgt, text, nchar, color )
386       if( sclstat .eq. 1 ) call sclon
387
388       call enpt
389
390       return
391       end
392
393
394 ** Name:
395 **  sclfac - return the world to frame scale factors
396 **
397 ** Interface:
398 **  subroutine
399 **  sclfac(real linw2f, real elew2f)
400 **
401 ** Input:
402 **  none
403 **
404 ** Input and Output:
405 **  none
406 **
407 ** Output:
408 **  linw2f    - number of frame lines    per world line
409 **  elew2f    - number of frame elements per world element
410 **
411 ** Return values:
412 **  none
413 **
414 ** Remarks:
415 **      An increment in world coordinates multiplied by the
416 **  appropriate scale factor will become an increment in
417 **  frame coordinates.
418 **
419 **  This routine also illustrates a helpful design principle:
420 **  if your application needs access to the inner workings of
421 **  a subsystem (in this case a common block), write an access
422 **  routine to extend the API rather than just including the
423 **  common block in your application.
424 **
425 ** Categories:
426 **  graphic
427
428       subroutine sclfac( linw2f, elew2f )

429
430       implicit      NONE
431
432 C --- interface variables
433
434       real      linw2f
435       real      elew2f
436
437 C --- constants and shared variables
438
439       integer       ifrm    ! frame number for graphics
440       integer       iwdth   ! line width
441       integer       mnele   ! upper left world element
442       integer       mnlin   ! upper left world line
443       integer       mxele   ! lower right world element
444       integer       mxlin   ! lower right world line
445       integer       sclfg   ! scaling on ?
446       real      scele   ! frame elems per world elem
447       real      sclin   ! frame lines per world line
448
449       common /M0FRACOM/ ifrm, iwdth, mxlin, mnlin, mxele, mnele,
450      &  sclin, scele, sclfg
451
452
453 C     // Implementation is trivial; just capture the common
454 C     // block values in the formal arguments.
455
456       linw2f = sclin
457       elew2f = scele
458
459       return
460       end
461
462 ** Name:
463 **  world - return the world coordinates of display corners
464 **
465 ** Interface:
466 **  subroutine
467 **  world(integer w_ullin, integer w_ulele,
468 **        integer w_lrlin, integer w_lrele )
469 **
470 ** Input:
471 **  none
472 **
473 ** Input and Output:
474 **  none
475 **
476 ** Output:
477 **  w_ullin    - upper left line of world
478 **  w_ulele    - upper left element of world
479 **  w_lrlin    - lower right line of world
480 **  w_lrele    - lower right element of world
481 **
482 ** Return values:
483 **  none
484 **
485 ** Remarks:
486 **  See sclfac() for a design note.
487 **
488 ** Categories:
489 **  graphic
490
491       subroutine world( w_ullin, w_ulele, w_lrlin, w_lrele)

492
493       implicit      NONE
494
495 C --- interface variables
496
497       integer       w_ullin
498       integer       w_ulele
499       integer       w_lrlin
500       integer       w_lrele
501
502 C --- constants and shared variables
503
504       integer       ifrm    ! frame number for graphics
505       integer       iwdth   ! line width
506       integer       mnele   ! upper left world element
507       integer       mnlin   ! upper left world line
508       integer       mxele   ! lower right world element
509       integer       mxlin   ! lower right world line
510       integer       sclfg   ! scaling on ?
511       real      scele   ! frame elems per world elem
512       real      sclin   ! frame lines per world line
513
514       common /M0FRACOM/ ifrm, iwdth, mxlin, mnlin, mxele, mnele,
515      &  sclin, scele, sclfg
516
517
518 C     // Implementation is trivial; just capture the common
519 C     // block values in the formal arguments.
520
521       w_ullin = mnlin
522       w_ulele = mnele
523       w_lrlin = mxlin
524       w_lrele = mxele
525
526       return
527       end
The mcgrdcon function computes and draws contours on a grid. Since contour drawing requires navigation, you must make a call to mapdef prior to calling mcgrdcon. The simple example below will draw contours using the value entered with the keyword CINT on the command line. If CINT=0, the mcgrdcon function will compute a contour interval and report it, drawing about 10 contour intervals.
The mcgrdcon function also has the capability to draw at specific contour values if those values are entered in the string table, and the non-numeric string name is entered as the contour interval. For example, if the user enters the two commands below:
| Type: | TE TEST1 "540 562 598 |
| GRDDISP ETA/00 PARAM=Z LEV=500 CINT=TEST1 UNIT=DM |
An ETA model 500 mb Z field is displayed with contours drawn at 5400, 5620, and 5980 m.
The code that handles this case, taken from grddisp.pgm, is shown below and continued on the next page.
The McIDAS-X library provides seven functions for plotting wind direction and speed using wind barbs and also provides a function for plotting vectors. The table below describes these seven functions.
The plotwind functions
plot wind speed without converting any units. A wind barb uses triangular flags
and long and short lines to represent wind speed. For example, the wind flag
here represents approximately 75 knots.
The functions that plot sky cover (mcplotskywind, mcplotskywindnav, mcplotskywindnavll) use the WMO code value for sky cover, which indicates the sky cover in eighths.
The pltwnv function plots wind speed using a vector. The vector length can be proportional to the wind speed or a fixed length. To set a proportional vector length, specify a length less than zero in the call. To set a specify a fixed length, specify a length greater than zero. In addition, a previous call to mapdef is required so the navigation functions accurately compute the wind position and direction.
The example below demonstrates the use of the mcplotwind, mcplotskywindnavll, and pltwnv functions.
subroutine main0
double precision direction      ! wind direction in degrees
double precision speed              ! wind speed in knots
double precision latitude       ! latitude in degrees N
double precision longitude      ! longitude in degrees W

real latlon(4)                      ! arrays needed by mapdef
integer tvbounds(4)
real navparms(4)

integer length                      ! unit length of wind flag/
                                ! vector
integer color_lev               ! graphics color to use
integer sky_cover               ! sky cover WMO code value
integer frame                       ! current frame number
integer hemisphere              ! hemisphere flag

integer ok

data length/40/
data color_lev/3/
data IWID/1/

c---Initialize the graphics routines

      IGDEV = luc(-5)
      CALL INITPL(IGDEV,IWID)

c---Define the wind direction and speed.

direction = 270.0
speed = 27.

frame = luc(-1)

c---Now plot the non-corrected wind flag at line 225, element 130.
c---Note in the display that the direction 270 degrees is plotted
c---straight left-right -- that is, it has not been corrected for
c---the navigation/projection.

hemisphere = 1

ok = mcplotwind(225, 130, length, color_lev, hemisphere,
& direction, speed)

c--- Define a new latitude/longitude for plotting a wind flag
c--- with a corrected angle.  Note that the plotted direction is
c--- correctly shown as an earth-relative 270-degree angle.

latitude = 41.
longitude = 140.
ok = mcplotwindnavll (frame, latitude, longitude, length,
    & color_lev, direction, speed)

c---Now give an example of a wind vector.  Note that this
c---is always corrected for the navigation.
c---
c---Note that a call to mapdef is required before calling
c---pltwnv; only one call per frame is needed.

ok = mapdef(latlin, tvbounds, 'SAT', navparms)

call pltwnv(nint(speed), nint(direction), 440000, 1400000,
    & color_lev, length)

c---Plot the wind flag and sky cover symbol at 35N 130W. The angle
c---of the wind flag is corrected for the navigation.

latitude = 35.0
longitude = 130.0
sky_cover = 3

ok = mcplotskywindnavll(frame,latitude,longitude,length,
& color_lev, sky_cover, direction, speed)

call endplt

return

end
|
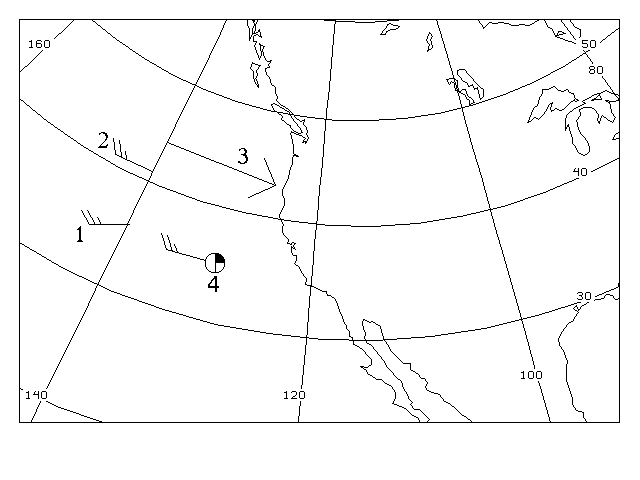
Figure 4-8 shows the results of the above example. For this example, the MAP command below was run to produce the background map in a conformal projection and navigation for the frame.
Note that wind flag1, generated by the mcplotwind call, makes no angle correction based on the navigation for the map projection. However, wind flag 2, generated by the mcplotwindnavll call, correctly rotates the wind direction relative to the earth to compensate for the map direction. Wind flag 3 was generated by the pltwnv call. Note the preceding mapdef call in the code. Windflag 4, generated by the mcplotskywindnavll, plotted both an angle-corrected wind flag and a sky cover symbol, as if constructing a station model plot.
Figure 4-8. Three wind barbs and a wind vector are plotted on a conformal projection.
The McIDAS-X library provides eight functions for plotting weather symbols. The table below describes these eight functions.
The McIDAS-X display is the device used to output image and graphical data. Use the two functions below to inquire about the characteristics of the display.
| Fortran function | C function | Description |
|---|---|---|
As a developer, you should use this information for validating display-related command parameters and for making environment-dependent programming decisions. For example, you can find information about the display type, the minimum and maximum valid color levels, or the number of default display lines and elements.
Both the itrmch and mcfsize functions isolate programs from directly accessing User Common, so you don't need to know the User Common index to find the value of a display characteristic.
Applications use the itrmch function to do the following:
To obtain a value, use the appropriate character string from the table below as the first argument to the function.
Strings ending in a question mark return 1 for true and 0 for false.
The itrmch function can be used to validate user-entered command parameters that relate to a display. The example below is from the ZA command. It exits if the color for the current terminal is out of range. The second argument is no longer used.
Frame sizes can vary within a McIDAS-X session. Your applications should never assume a size but instead call the mcfsize function to return the size of a given frame in lines and elements, as shown in the code fragment below.
[Search Manual] [Table of Contents] [Go to Previous] [Go to Next]


