McIDAS-V Point Observation Plots
[Satellite | Model | Radar | Observation]
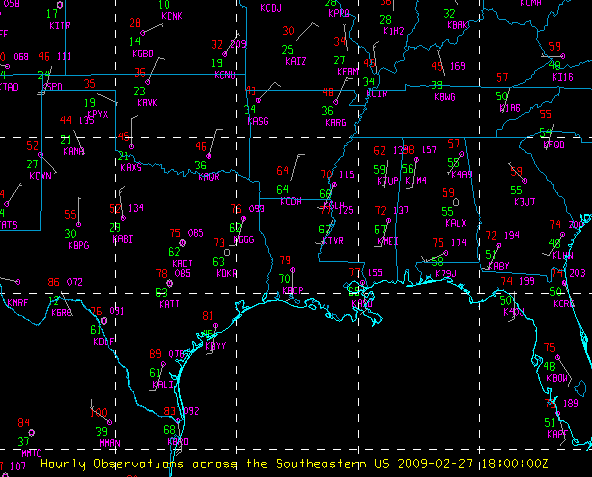
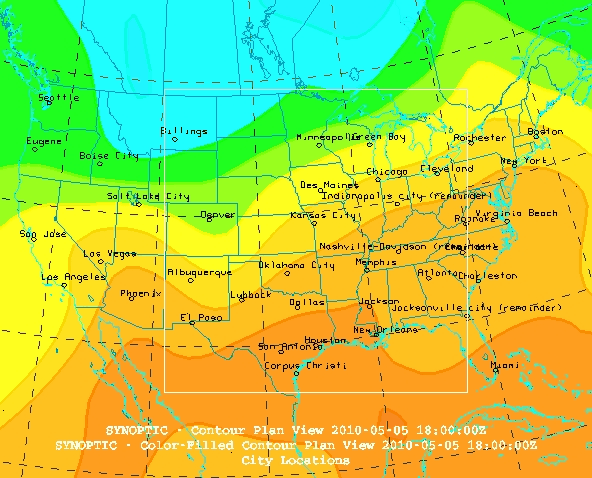
McIDAS-V can display real-time point observations from around the world. METAR and synoptic surface weather station observations can be plotted or contoured, and time series charts of meteorological parameters can be created for a given location. Upper-level RAOB data can be plotted or contoured in 2- or 3-dimensions, and also displayed as soundings, hodographs, or time series charts. Wind profiler data can be displayed as time series or time height displays. Powerful mathematical tools allow for user-created formulas and customizable output of the data. The remapping and overlaying capabilities of McIDAS-V make integrating point data with other meteorological and geophysical data simple for even the novice user.
The examples below demonstrate some of the capabilities of McIDAS-V with point data. Click on the image to view a larger version. If applicable, a link to the example bundle is also provided for interactive use in McIDAS-V.
[All examples on this page were created by members of the McIDAS User Services using McIDAS-V software.]