McIDAS-X Text and Observation Data
[ Satellite | Model | Observation | GIS Apps ]
McIDAS-X provides a robust suite of application tools for managing, processing, comparing and fusing data. Users access and integrate various data types by displaying images and graphics separately or simultaneously. Current, past and forecast data displays can be animated to monitor changes.
McIDAS-X reads and outputs:
- contours and plots of meteorological data in McIDAS MD, netCDF or text format
- observed parameters – such as temperature, dew point, wind speed and direction, pressure, cloud information, height of pressure surface
- derived parameters – such as equivalent potential temperature, mixing ratio, stability indices, heat index, wind chill index, potential temperature, isentropic surfaces
- forecast parameters from Model Output Statistics – such as temperature, wind speed, probability of snow
[All examples on this page were created using McIDAS-X software. Some were created by members of McIDAS User Services and some were downloaded from sites listed on the SSEC Web page under “Research” or “Images and Data“]
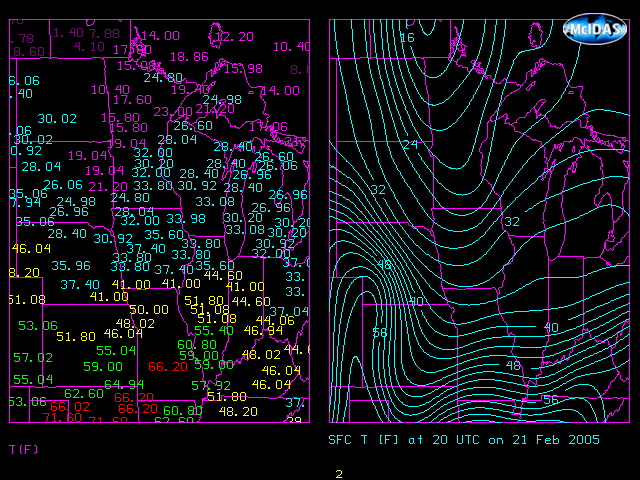
Interpolation of observed, derived, or forecast parameters to derived fields on uniformly spaced grids [surface temperatures plotted and contoured]
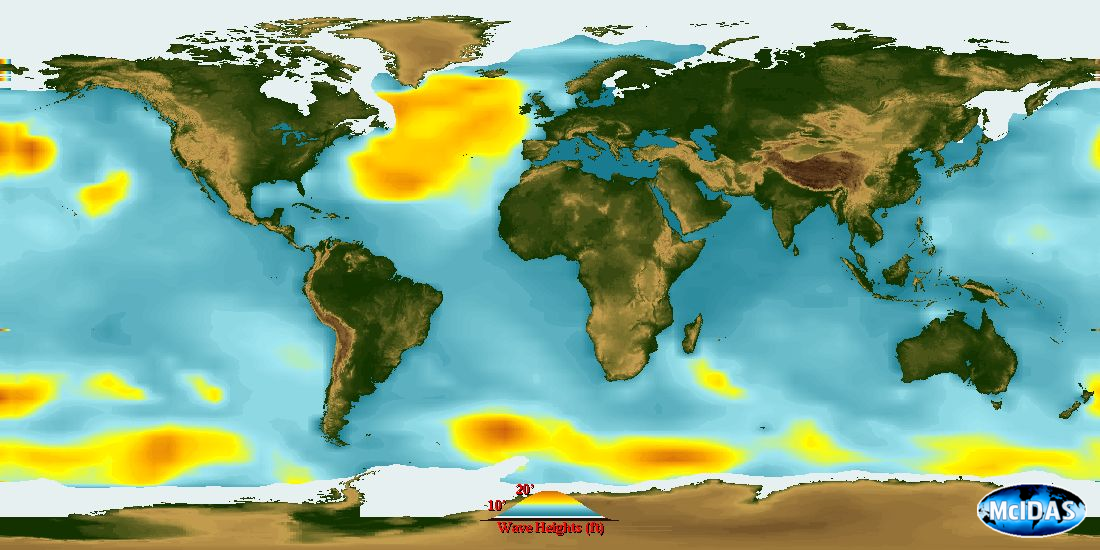
Interpolation of observed, derived, or forecast parameters to derived fields on uniformly spaced grids [global wave heights]
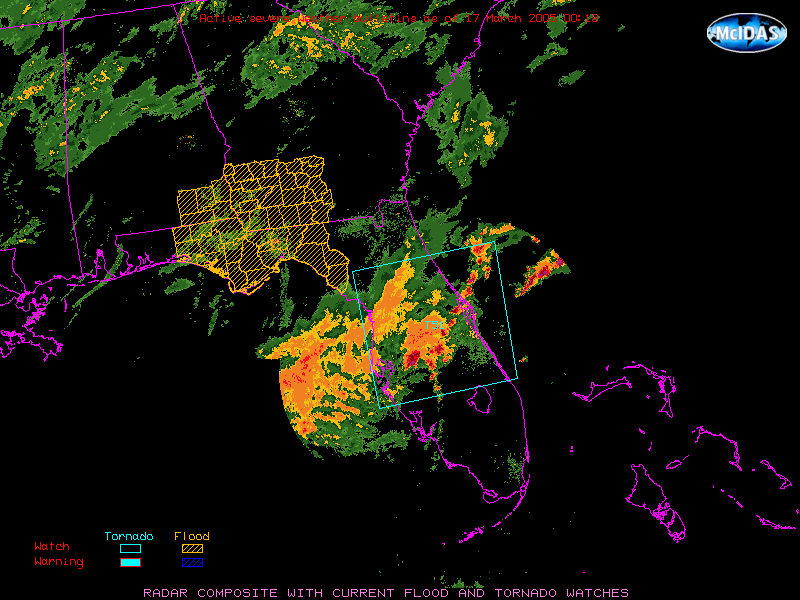
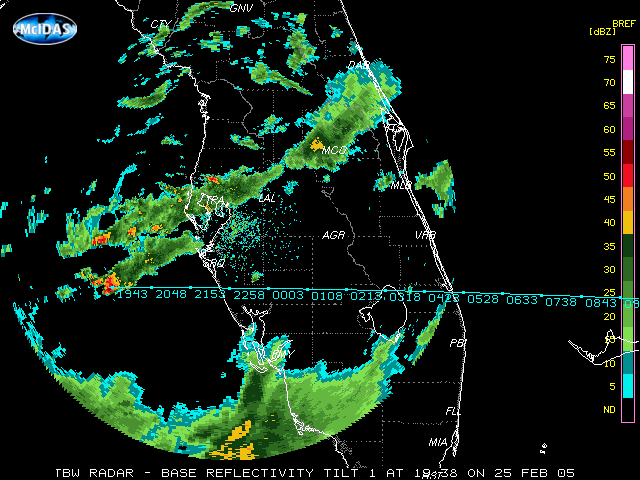
Plots and listings of weather watches and warnings [watches over Florida NEXRAD composite]
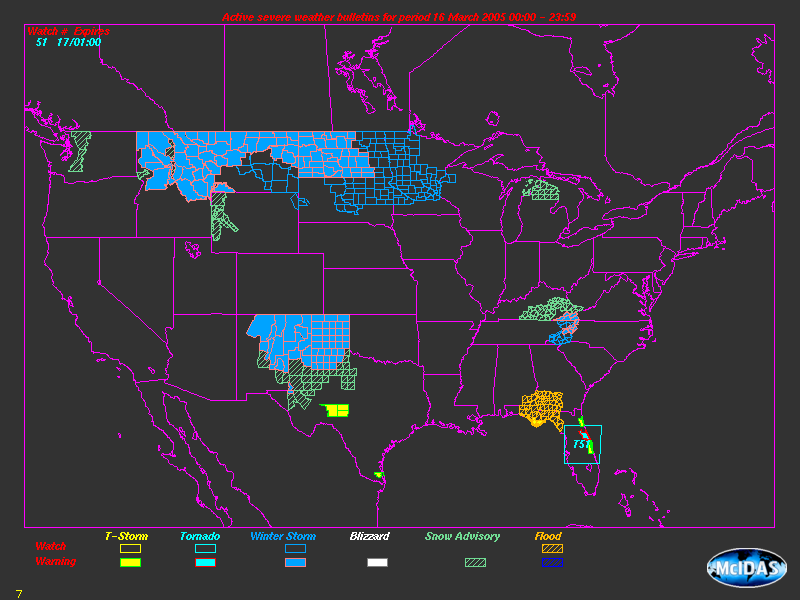
Plots and listings of weather watches and warnings [ all watches and warnings in the United States]
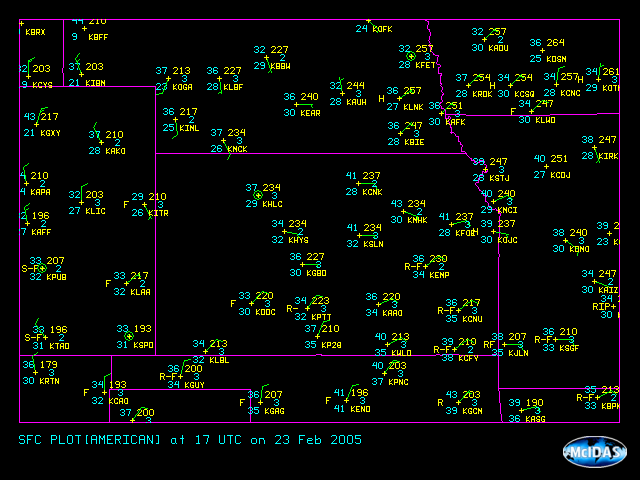
Station model displays [surface observations in Kansas]
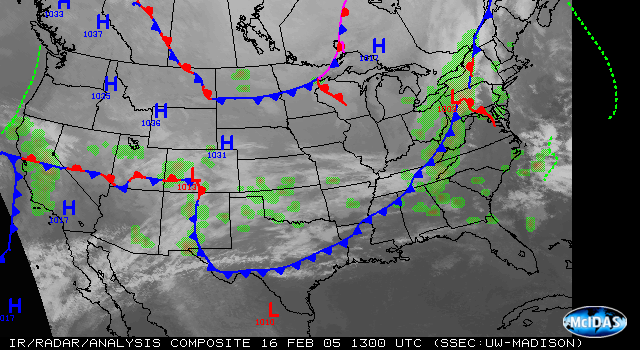
Fronts from NCEP frontal position products [fronts and radar over satellite IR composite image]
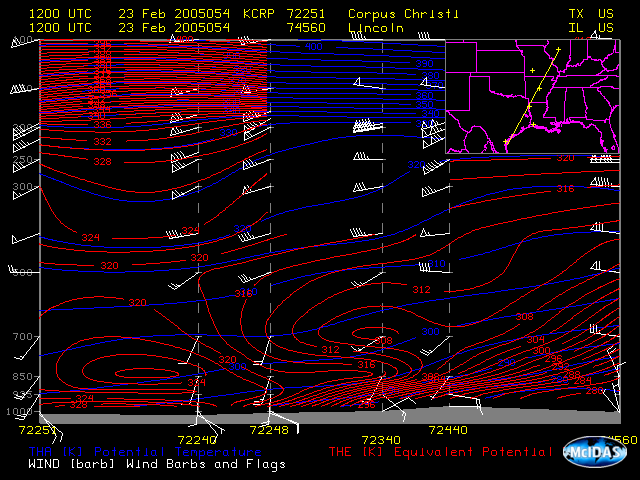
Cross sections: surface and full vertical isentropic [cross-section of theta and theta-e from Texas to Illinois]
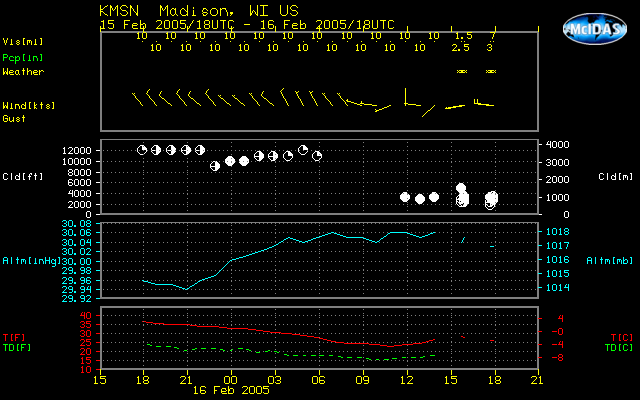
Temporal and spatial meteorograms: historical trace of surface and upper air parameters [surface meteorogram]
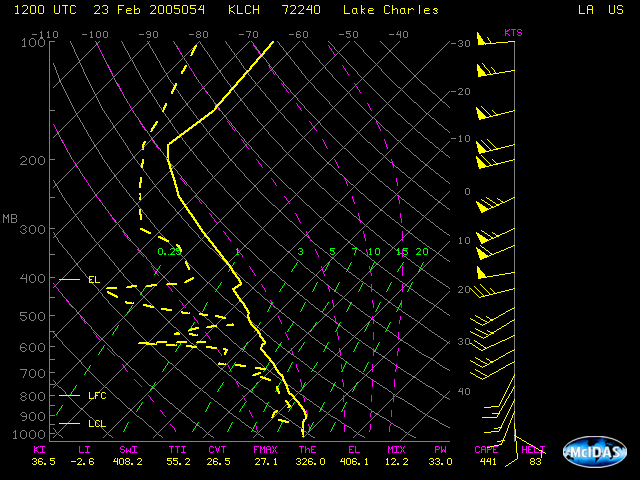
Thermodynamic diagrams: [skew T/log-P]
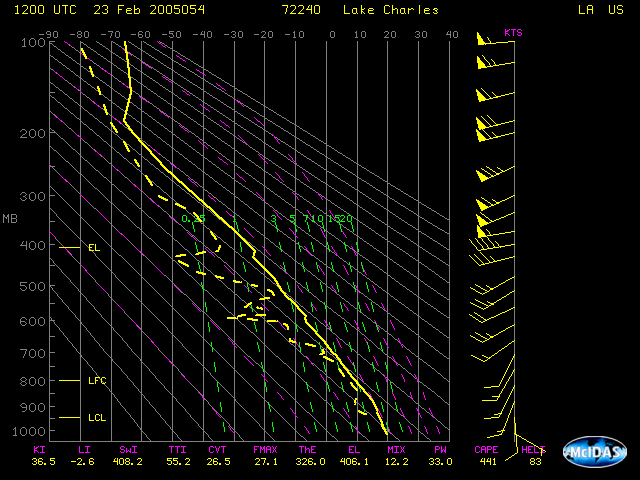
Thermodynamic diagrams: [Stuve]
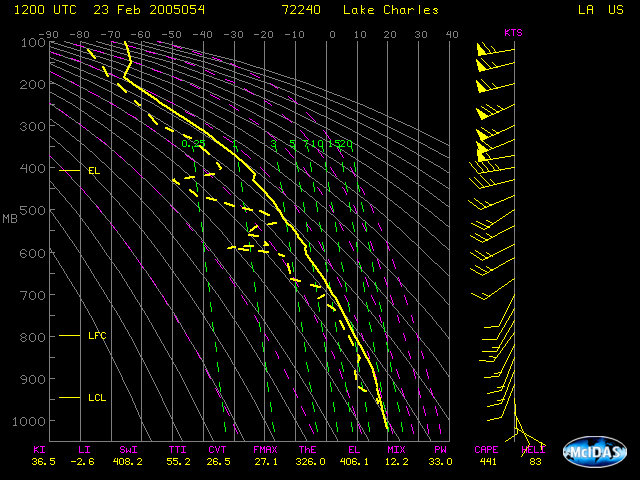
Thermodynamic diagrams: [linear]
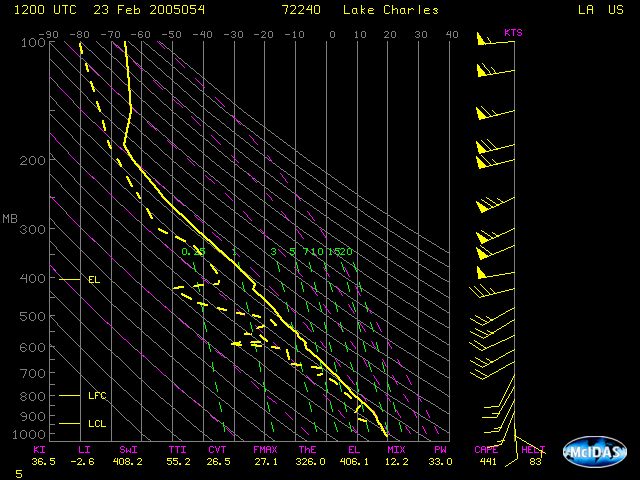
Thermodynamic diagrams: [Emagram]
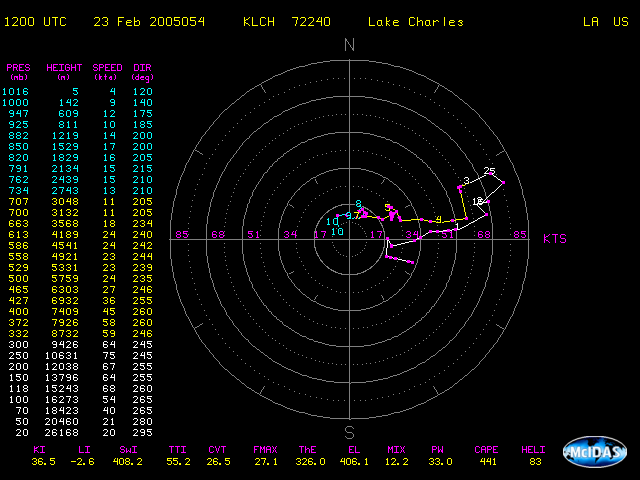
Hodographs: [vertical wind soundings]
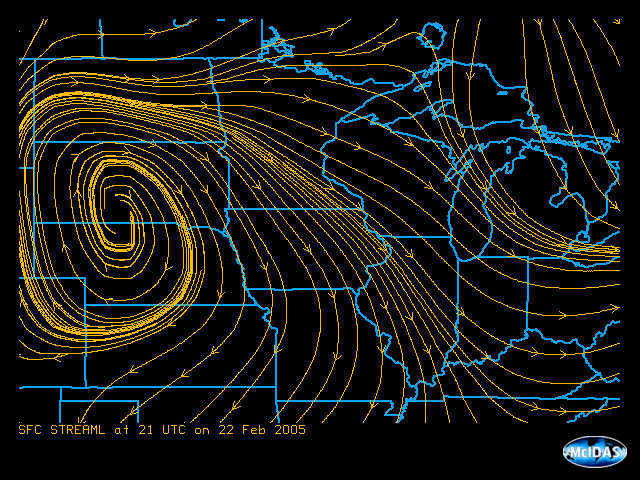
Streamlines of vector fields [surface winds over Midwest]
Feature movement prediction [storm movement]
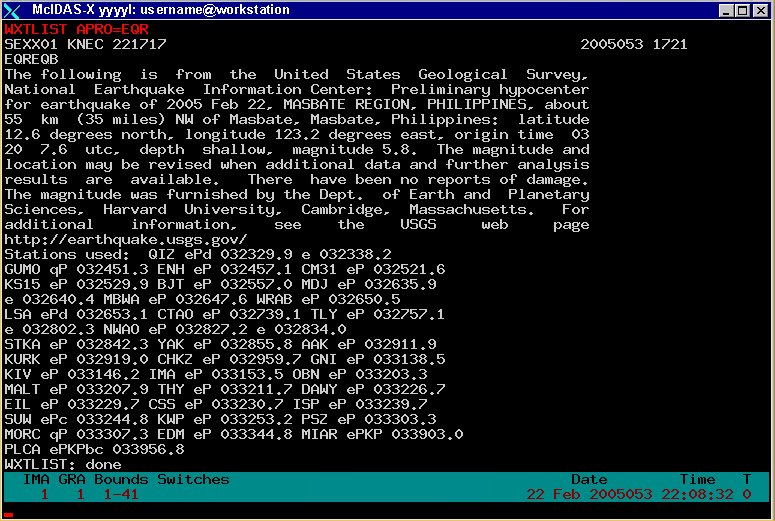
Search and display weather text data [NOAAPORT text output]