McIDAS-X Satellite Imagery Examples
[ Satellite | Model | Observation | GIS Apps ]
McIDAS-X provides a robust suite of application tools for managing, processing, comparing and fusing data. Users access and integrate various data types by displaying images and graphics separately or simultaneously. Current, past and forecast data displays can be animated to monitor changes.
McIDAS-X:
- includes support for GOES, NOAA/POES, Meteosat, MSG, MODIS and other satellite data [see SSEC Satellite Data Services for the current list]
- displays and manipulates images in a variety of formats, including McIDAS AREA, Aqua AIRS and MODIS Level 1b HDF, MSG Level 1.5, SAA POES/NOAA KLM series AVHRR Level 1b, GVAR, and GOES ABI and MTG netCDF
- saves displayed images and graphics in GIF, JPEG and other formats
- converts raw values to radiometric or other units – such as radiance, albedo, brightness temperature
- contours radiometric values
- maps between radiometric values and grayscale
- manipulates images, allowing the user to:
- mathematically combine or modify images
- filter the data with various algorithms – such as selecting data breakpoints, averaging or weighting surrounding pixels
- derive products from multi-spectral analysis – such as vegetation index, sea surface temperatures, cloud heights, rainfall, long wave flux
[All examples on this page were created using McIDAS-X software. Some were created by members of McIDAS User Services and some were downloaded from sites listed on the SSEC Web page under “Research” or “Images and Data“]
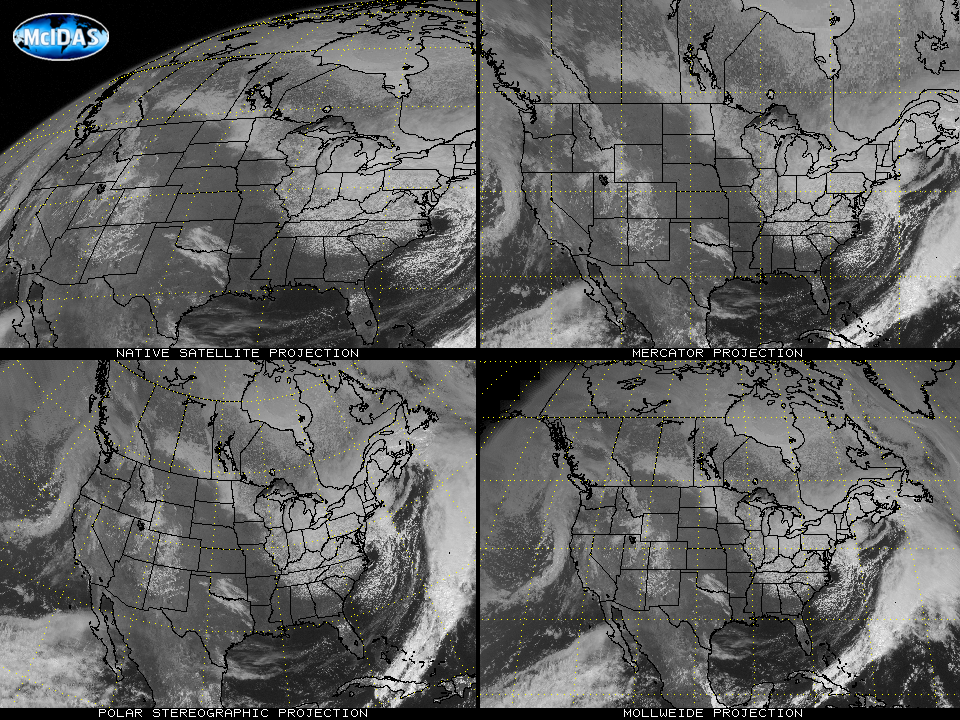 United States in four different projections
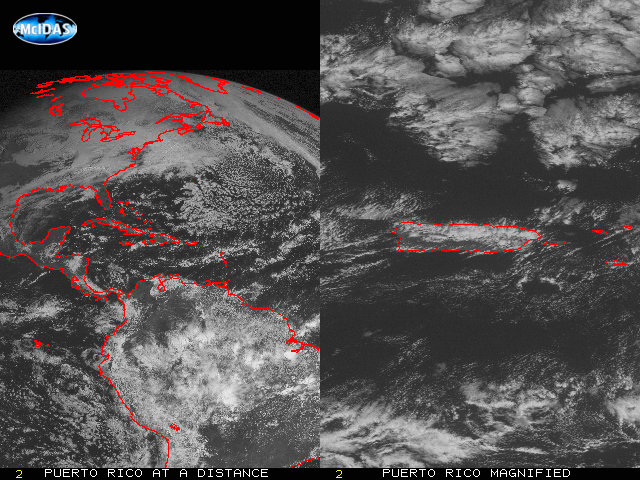
Magnify or blow down images from their original resolution
[two views of Puerto Rico]
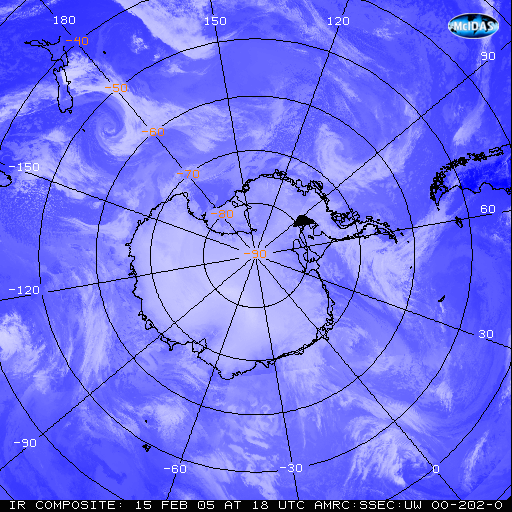
Create composite images:[Antarctic composite]
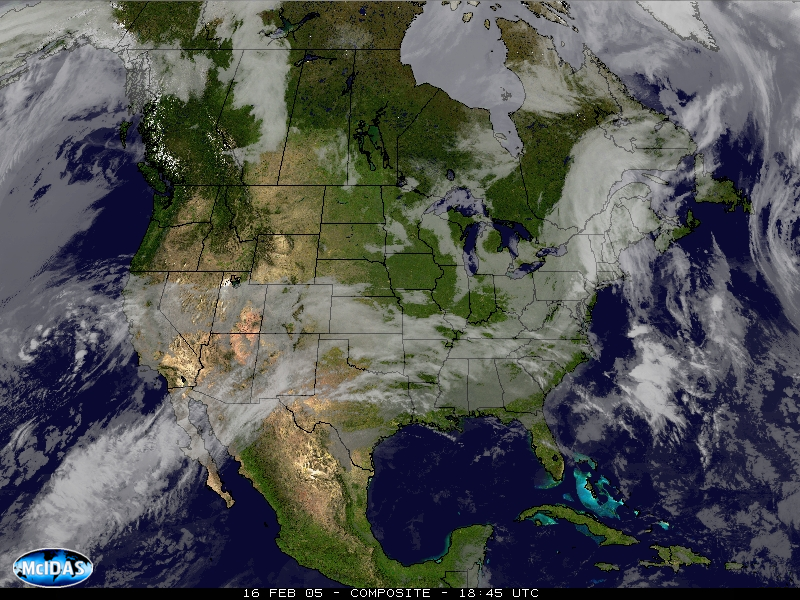
Create composite images:[US composite]
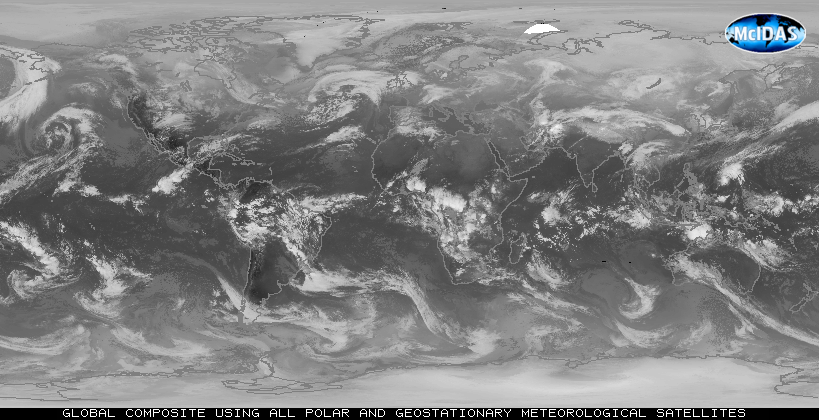
Create composite images:[global composite using all polar and geostationary meteorological satellites]
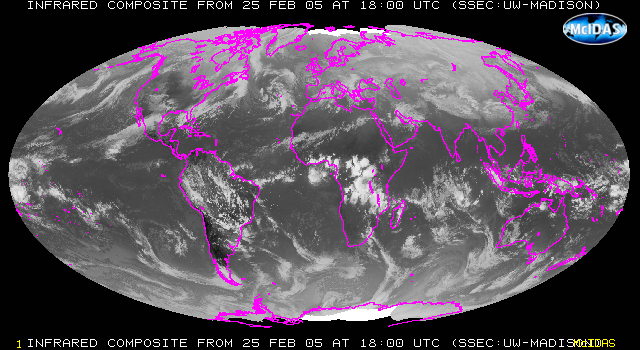
Create composite images:[global Mollweide composite]
Animate sequences of images to make a movie [GOES-10 IR loop]
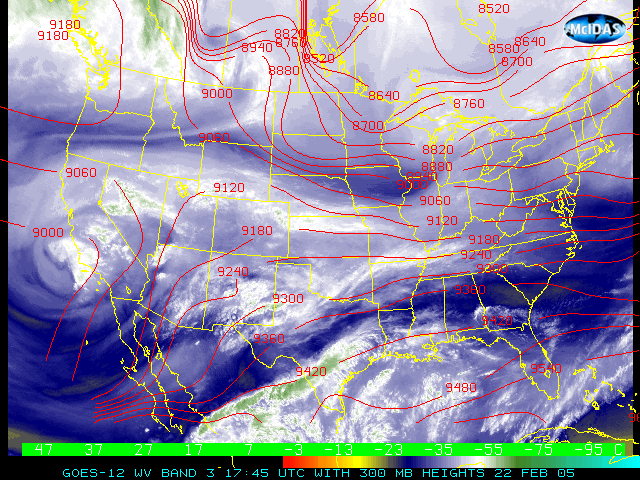
Apply grayscale and color enhancements [GOES-12 water vapor]
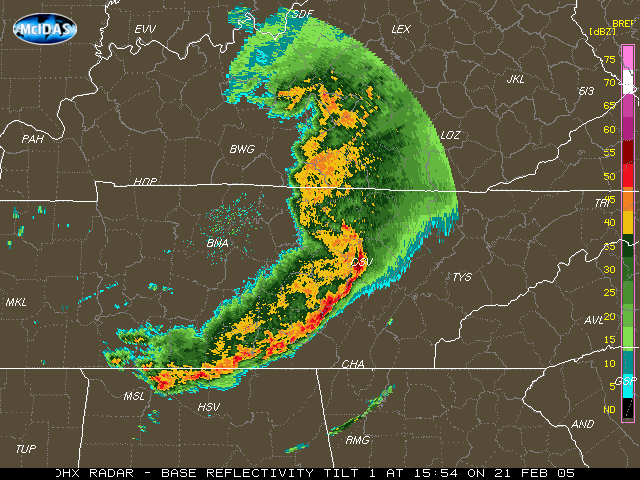
Display NEXRAD imagery [Nashville NEXRAD]
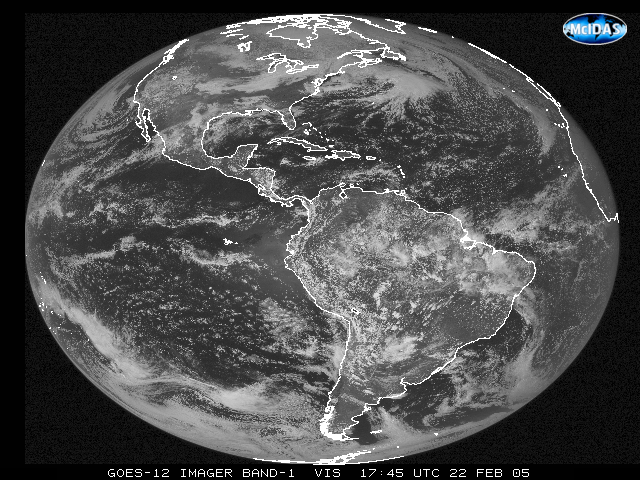
Overlay images with maps and graphics from other data sources [full disk with map]
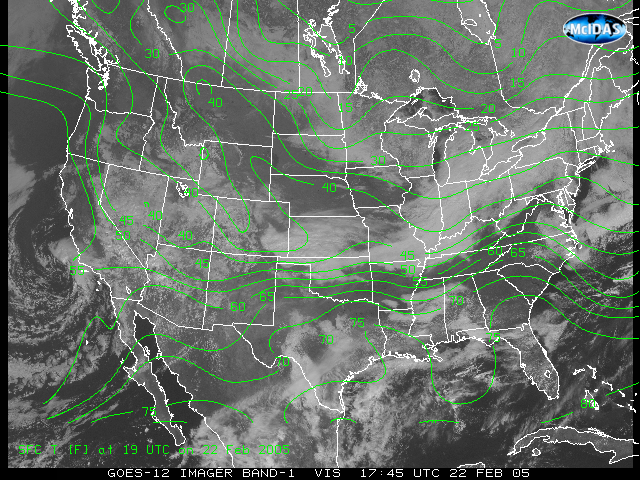
Overlay images with maps and graphics from other data sources
[United States with temperature contours]
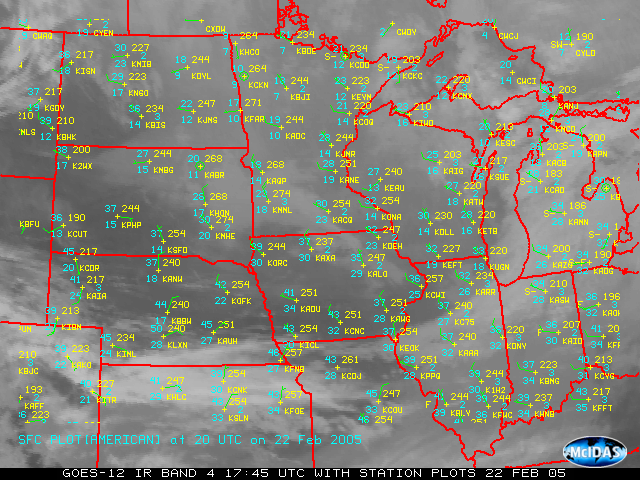
Overlay images with maps and graphics from other data sources
[Midwest with station models]
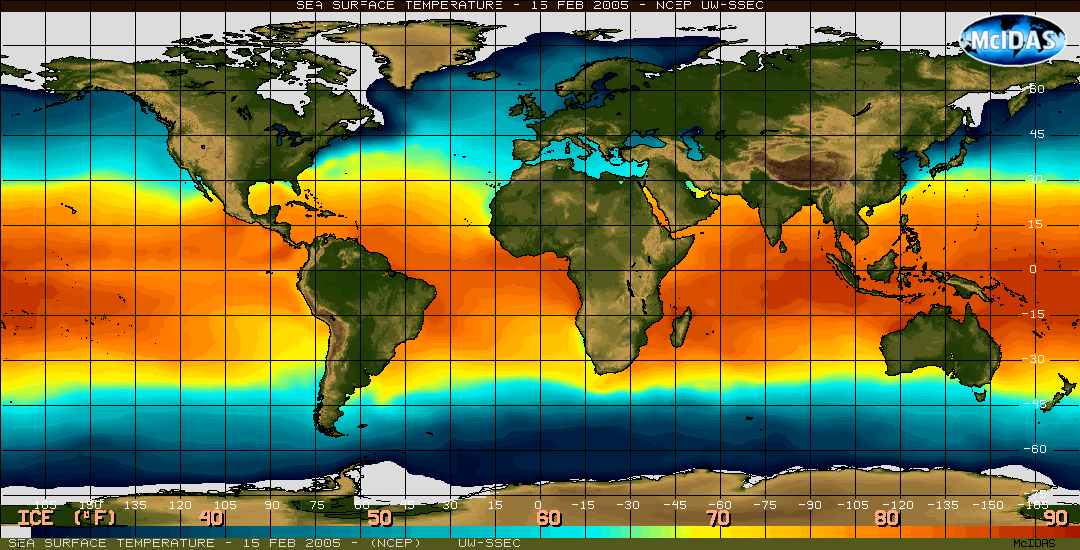
Derive products from multi-spectral analysis – such as vegetation index, sea surface temperatures, cloud heights, rainfall, long wave flux [sea surface temperatures]
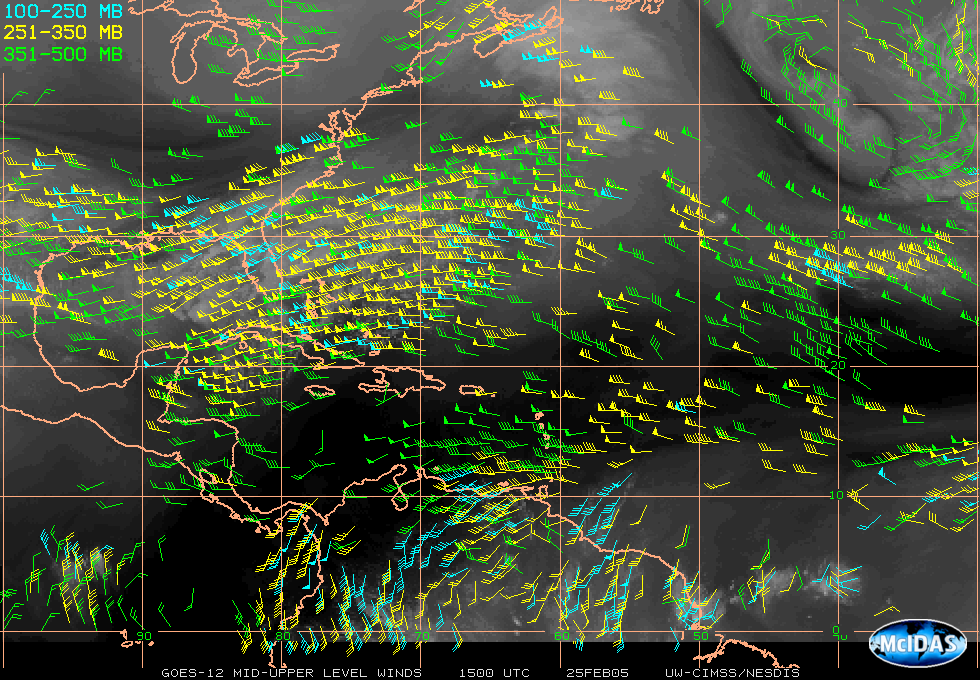
Calculate and display cloud drift winds [GOES-12 Mid- and Upper-level winds]
Plot satellite navigation tracks [predicted Terra passes]