CSPP GeoSphere provides new view of GOES-16 imagery
Geostationary weather satellites are uniquely situated to monitor changing environmental conditions by providing near real-time data and imagery to view them over time.
Scientists at the University of Wisconsin–Madison Space Science and Engineering Center and the Cooperative Institute for Meteorological Satellite Studies developed the CIMSS Community Satellite Processing Package for Geostationary Data to build on this capability.
SSEC researchers recently created a website, CSPP GeoSphere, to visualize data from NOAA’s GOES 16 Advanced Baseline Imager in near-real time. This is built on top of existing CSPP Geo products and other open source software packages.
true color and a night microphysics RGB composite. Credit: David Hoese
SSEC researchers Graeme Martin, David Hoese, Clayton Suplinski and Ray Garcia developed CSPP GeoSphere to visualize satellite data in a clean, user-friendly interface while taking advantage of new cloud-computing technologies and CSPP Geo Software.
“Scientists can get a quick preview of what the instrument is seeing and what is in the data,” says David Hoese. “This web interface also works well for anyone at home or for those who don’t have access to this data or don’t have the hardware or experience.”
Real-time data displayed on CSPP GeoSphere are acquired from one of the rooftop antennas at SSEC. The new software converts the observed data files into near real-time images that are displayed as quickly as two minutes for mesoscale images and five minutes for full-disk images. The low-latency is a combination of how the data flows through the designed system and its incorporation of features of other CSPP Geo products, like CSPP Geo GOES Re-Broadcast and CSPP Geo Geo2Grid.
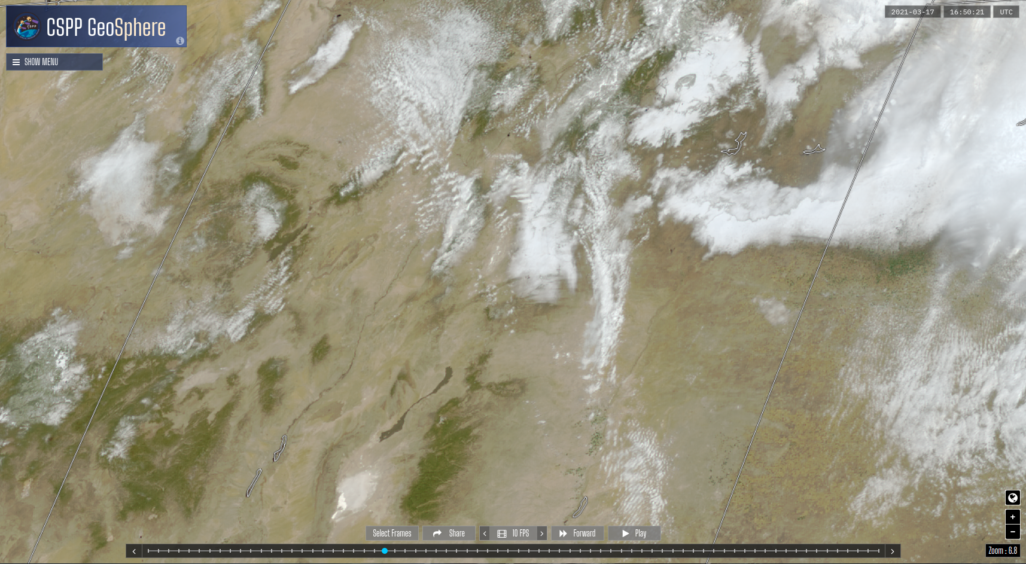
Geosphere shows land and cloud features with 500m spatial resolution. Credit: Dave Hoese
CSPP GeoSphere is dedicated to visualizing GOES-16 ABI data. The ABI has 16 bands that correspond to different visible or infrared wavelengths in the electromagnetic spectrum. CSPP GeoSphere allows users to display the information contained in each wavelength to look at real time atmospheric conditions such as snow and ice or clouds. In addition, true color – a mode that mimics what the human eye would see during daytime – is a display option that combines multiple bands.
Users can view imagery in 10-minute time frames for full disk, 5-minute time frames for the continental United States, and 1-minute time frames for mesoscale domains. Another option produces animations for a certain time period, with the added feature of automatically refreshing as new data are processed. These animations allow users to view the high spatial and temporal resolution ABI data in an easy to use web interface.
This work supported by SSEC and NOAA.